With the first quarter of 2014 but one trading day away from completion, Gold's anticipated, overdue, healthy, dare we again say welcome correction notwithstanding, when looking to the world's great financial markets that comprise the spectrum of "BEGOS" (Bond/Euro and Swiss/Gold, Silver and Copper/Oil/S&P), the clear leader year-to-date is the yellow metal itself:
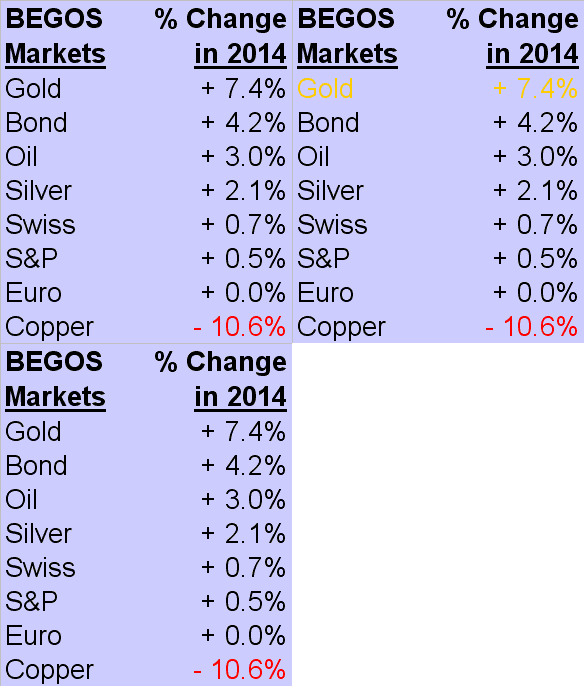
'Course the glittery paparazzi press fawn over the glamourous stock market, (+0.5% ... I'm impressed). But as for the reportedly-bereft Bond market being +4.2%, (who knew?). Not much gab out there about the global economic leading indicator Copper's being -10.6% (gulp...)
Indeed, year-to-date Gold has been up as much as 15.6%; but now one-half of 2014's gains are gone. Yet if the Sybil had told us at 2013's end that Gold would be up better than 7% through the new year's Q1, sighs of relief would've abounded, and ever so distinctly, here we are.
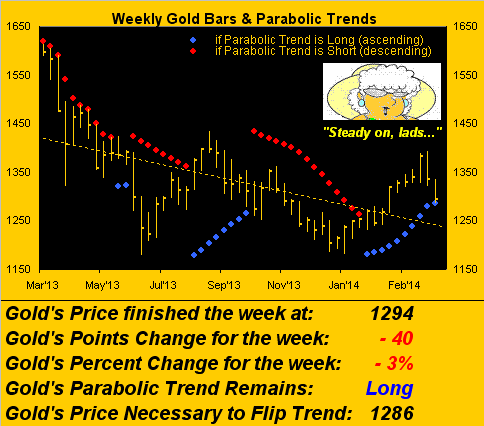
To be sure, 'tis been a steep pullback these last two weeks, but as a great friend of The Gold Update would put it: "Steady on, lads...". Not that we've fallen out of touch with Gold Nanny, but she really has gone to ground over the last year-and-a-half, no doubt fortifying her precious metals/wet bar bunker in Lancashire, (or as she likes to say: "Morecambe, actually"). Nevertheless, the encouragement of her level-headedness appears entirely appropriate at this juncture, despite Gold's being so near to flipping its weekly parabolic trend from Long to Short: as you can see below, there are but eight points of wiggle room from the current price of 1294 to the parabolic flip level of 1286. Yet on the cusp of such arbitrary technical event, Gold is just barely flirting with the 1290-1275 band of Market Profile support that was formed prior to price's vertical rocket shot up to 1392. So although we're just a nudge now away from a bit of further negativity, we expect 'twill be short-lived of its own accord. "They" might try to scare us, whacking us about in another supportive area that spans the 1280-1240 zone, however I would not be surprised a wit if the new week instead turns out to be as low as we go before resuming onwards and upwards. Meanwhile, here is the "now":
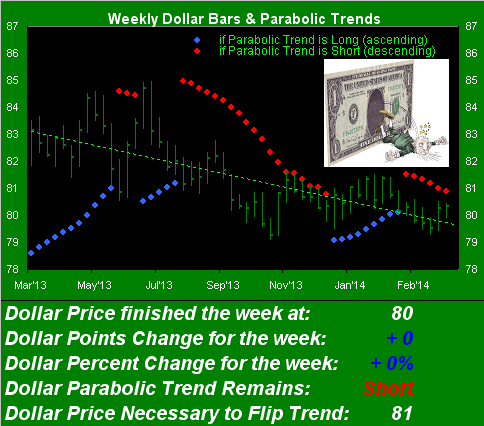
Nobody said 'twas going to be a boring year for Gold. And the trite line of "Dollar strength" is again conveniently making the FinMedia rounds: "convenient" as 'tis part of their formulated pap rather than their actually putting in the analytical work. For the same one-year parabolic time frame study as we regularly show above for Gold, here is the version for the Dollar Index. What a "power market", eh?
Further, the conventional wisdom says that Gold's strong push thus far in 2014 is comprehensively due to geo-political concerns, notably those related to Crimea, (which by now must have been resolved given price's pullback, right? Wrong...). My take in such vein is that Gold has been rising over a far more dire geo-political concern: increasing global monetary worthlessness and the "uh-oh" factor thereto gaining more visibility. Price was already well on the move up earlier in the year when many thought that Crimea was a safety nuisance problematic to living in Chicago. No, Gold I'm not worried about and am grateful to be in its dinky ownership minority. Better still to avoid the direct blow of that which the majority owns:
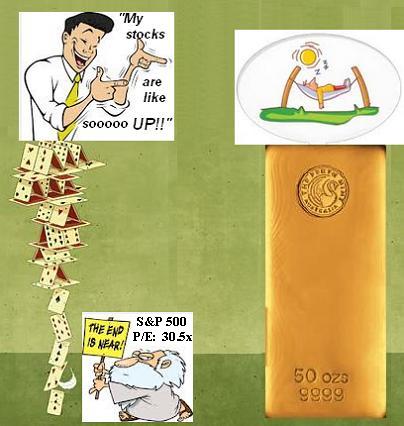
From our perspective of being on "crash-watch", 'tis beyond untoward that the S&P has not been able to manage even a 10% correction, (the last one was in June 2012). But consider this per the little fellow in the above graphic: were the S&P to correct 50% and the p/e ratio be linear, 'twould be 15.25x -- still not cheap even were the Index to be halved!
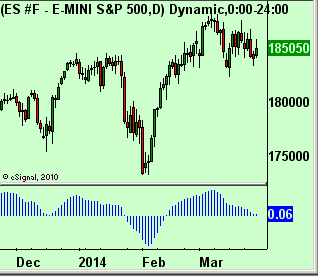
One more word on the stock market: if you've been following the website's "Prescient Commentary", you already know that the S&P's price oscillator study -- the blue bars as shown below on the futures' daily time-frame -- is poised to go south, (which per our Market Rhythms page yields a profitable tendency):
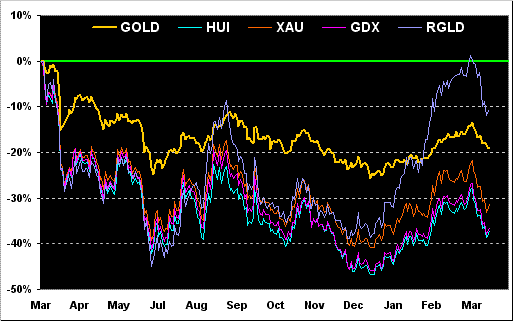
As noted at the outset there remains one trading day to close out Q1, however let's assume 'tis now month's end and thus we go year-over-year with the percentage track of Gold versus those of its equities' ilk, namely the HUI Gold Bugs Index, the XAU Philly Exchange Precious Metals Index, the GDX exchange-traded fund for miners, and our favourite "G-Force" Formula One ride: the royalty company Royal Gold (RGLD). All five measures are sub-zero percent (the green axis), but herein you can really see how the volatility of the equities outpaces that of "savings account" Gold itself, (and you routinely do add to your savings, no? There's a good lass):
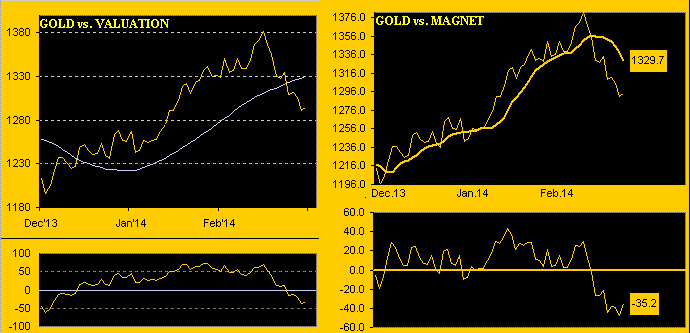
As to Gold itself, here next is a two-panel graphic of the daily closes for the last three months-to-date. On the left we've Gold versus its smooth, pearly valuation line which is a measure of price's movement relative to those of the primary BEGOS markets: Gold having penetrated the valuation line to the downside is a trading negative, albeit per the left-side oscillator (price less valuation) at the graphic's foot, the -50 area is typically suggestive of an oversold condition. On the right we've the same price track for Gold, in this case versus its Magnet (in the yellow box) which is the contract volume-weighted measure derived from Gold's Market Profile data that we'll later view: you'll recall our concern during Gold's strong rise this year was that (notably per the right-side oscillator), price was getting too far afield above the magnet, and thus our expectation for an naturally "magnetic" pullback. We finally we got it, but such that the oscillator's yellow box is now too far the other way, wouldn't you say?
As for Gold's "Baby Blues", those dots along the daily bars that measure the consistency of price's 21-day linear regression trend, their beginning to weaken as far back as two weeks ago was the early warning that the needed correction was nigh...
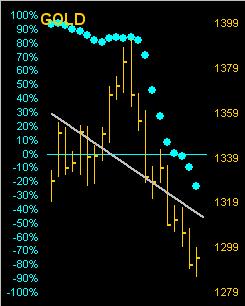
...which in turn brings us to the aforementioned Market Profile. And as you can see below, there is quite a bit of near-term overhead resistance to overcome. Notably, Gold's current level is right at the apex supporter down there at 1294:
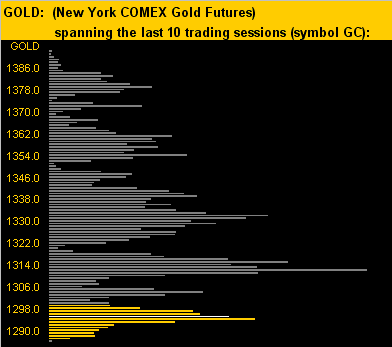
Again 'tis worth emphasizing the prior Market Profile support already built into the 1290-1275 area -- and should we get one more Gold "scare" -- that the 1280-1240 zone is also structurally supportive as listed in the Gold Stack at the foot of this missive. From the correction commencing two weeks ago, my sense remains that 'tis within the context of Gold's shifting from a medium-term bear phase back into resuming its broadest-based bull phase and that the pullback's duration shall be for some three weeks, (i.e. two down, one to go), cooler prevailing heads then not missing the chance to get in on the cheap.
As ever, we maintain that a strong Gold ally throughout the dough debasement debacles des jours is an increasing awareness of the equities asset bubble and that "the jig is up" -- or better stated "down" -- for the S&P. Quite the Gold Positive that, as are so many of the past week's fundamental headlines that surely shall keep on comin':
"... Gold rush in Japan as tax rise looms; critics say Tokyo cannot ignore its debt mountain forever ... German sentiment falls ... Falling prices in Spain boosts bets on further economic stimulus ... Russia out of G-8; funds cut Russian holdings ... The Fed's share of the mortgage bond market has grown so large that it is dampening the trades by other investors that could add fuel to any increase in bond yields ... PBoC steps in to calm China bank run after small rural lender sparks concerns ..." (it has to start somewhere).
Here's how Gold stacks up at the moment:
Gold’s All-Time High: 1923 (06 September 2011)
The Gateway to 2000: 1900+
The Final Frontier: 1800-1900
The Northern Front: 1750-1800
On Maneuvers: 1579-1750
The Floor: 1466-1579
Le Sous-sol: Sub-1466
Year-to-Date High: 1392
Base Camp: 1377
The 300-day Moving Average: 1376
10-Session “volume-weighted” average price magnet: 1330, (directional range: 1393 down to 1286 = -107 points or -8%)
Structural Resistance: 1320-1327 / 1479 / 1524-1535
Trading Resistance: 1304 / 1312-1315 / 1332 / 1339 / 1354 / 1361 / 1372 / 1379
Gold Currently: 1294, (weighted-average trading range per day: 19 points)
Trading Support: right here at 1294 with prior Profile support at 1290-1275
The Weekly Parabolic Price to flip Short: 1286
Structural Support: 1280-1240 / 1227 / 1163 / 1145
Year-to-Date Low: 1203
Finally, this somewhat dourly hilarious item of the week from Bloomy, as paraphrased: "Goldman Sachs and Société Générale can thank Janet Yellen for helping to get their bearish forecasts for Gold back on track." I tell ya folks, Gold puts in just its second lower week after having finished higher in 11 of the prior 13, and the beatdown is back. But here's the FAT question: Does this mean that SocGen strategist Albert Edwards may have to lower his Gold price target from $10,000 to only $9,000 or perhaps just $8,000? Jeepers, Al, say it ain't so!