As the dust settles 'round Scotland's succumbing to remain a suckling pig, whilst Alibaba and its nearly forty thieving underwriting banks revel in their money-stuffed pigsty, I raise my humble hand to request that the conversation now be redirected toward an topic of actual substance:gold.
Not that Scotland isn't important: its GDP, per 2012 compilings by the IMF and Bureau of Economics, now exceeds that of Alabama -- ('tis alright, feel free to applaud). Nor is the initial public offering for Alibaba not important: it makes for good television, keeping advertisers sated at a time when FinMediaTV ratings have fallen to multi-decade lows -- ('tis alright, feel free to change the channel).
Indeed, welcome to the Substance Station, where our primary focus is upon gold as the valued mitigant to the pending "pop" in otherwise non-substantive monetary assets. Yes, gold remains under technical shorting duress -- ('tis alright, feel free to accumulate down here on the cheap). Were the great Robert Frost, (mother of Scottish descent), to wax poetic today, he might thus compose "Two investment paths diverged in a monetary wood, and I, I took Gold -- less traveled by -- and that has made all the difference." 'Twill so do.
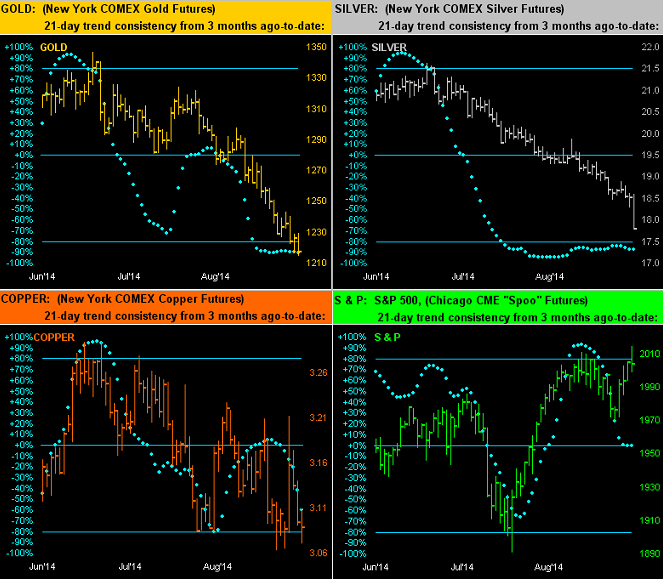
But for the present, the pounding across the metals pits is poignantly palpable. We begin with the four-panel graphic below showing the daily bars for the past three months-to-date of gold, silver, copper and the S&P 500. The baby blue dots represent each market's respective 21-day linear regression trend consistency, (which when under -80% defines such trend as consistently down). Take from the graphic that which you will, (i.e. the obvious observance being the metals as pitched into the dustbin). Yet therein, two of the four markets ought at least raise a perceptive eyebrow. First look at silver: as has been our pending concern for several weeks, price finally is now sub-18, settling out yesterday (Friday) at 17.790. Sister Silver now appears well and truly oversold and here's why: recall our cocktail recipe whereby putting the precious metal gold and the industrial metal copper into a blender, and then hitting the purée button, you thus get Silver, (her being a metal that is 50% precious and 50% industrial)? That in mind, note below that copper is also on the skids, but certainly not nearly as consistently so as for gold: thus imagine mixing the gold and copper panels of the graphic together and hardly would you get something as relentlessly down as is Silver. So again, 'tis oversold. Second look at the S&P: should not a rising stock market be supported by rising industrial metals prices? Cue Inspecteur Clouseau: "Not any moouuuure, for 'tis the Fed yeuw kneuw...." To be sure, copper and the industrial metal aspect of Silver aren't supporting the S&P a wit, nor are its own descending "Baby Blues" (see them falling?), nor as we'll later view, is a present pullback in the Economic Barometer:
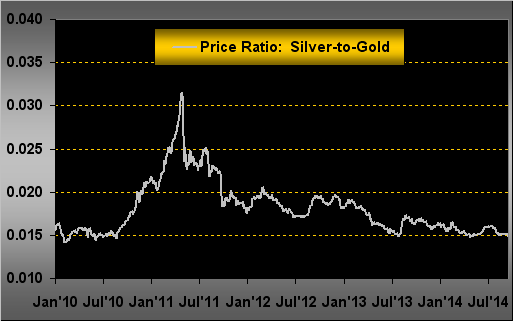
Perhaps to help quell your quease of silver's unease, here is the price ratio of silver-to-gold from 2010-to-date. Seems as if she's finally back down to earth. Welcome home, Sister Silver:
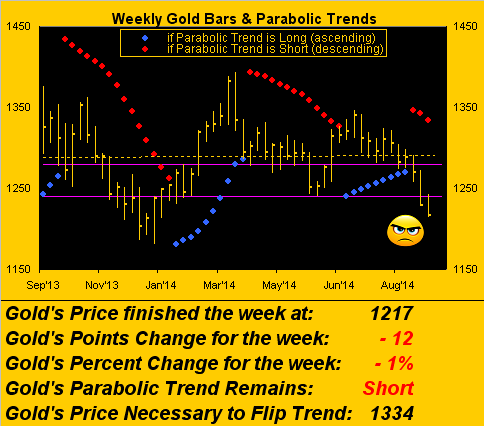
Meanwhile, gold itself continues along beneath the guide of the descending red dots shown below in yet another annoying parabolic Short trend per the weekly bars. Further, the 1280-1240 support zone (between the purple lines) has been bust, such that should the trend continue hardly to be our friend -- but rather a pain in the rear end -- not only this year's low (1203) but indeed that of last year (1180) ought be ripe for a test...
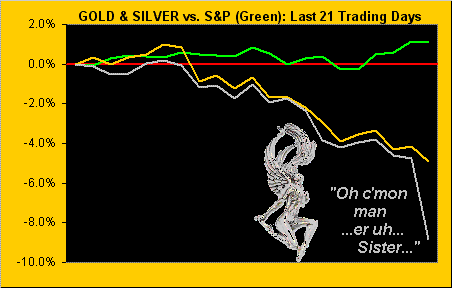
...unless the S&P finally turns tail, which by our measure has been due now for years. Gold and the S&P essentially remain in negative correlation as we next see per their month-over-month comparative percentage tracks, onto which we've also added that for Silver to again emphasize just how oversold she's become -- especially given the drop in this most recent week alone of -4.5%, her second worst five-day fizzle of the year:
'Course, mid-week we had the FOMC's policy statement on interest rates with Federal Reserve Bank Chair Yellen emphasizing that rises thereto shan't occur for a "considerable time" and only then should the data so warrant. The stock market naturally likes that, continuing right along in its "party 'til the cows come home" mode, despite our "live" S&P price/earnings ratio of 36.7x suggesting the Index ought be half its current level, and an Economic Barometer -- at least for the present -- that is drawing a dip whilst the market merrily heads in the other direction:
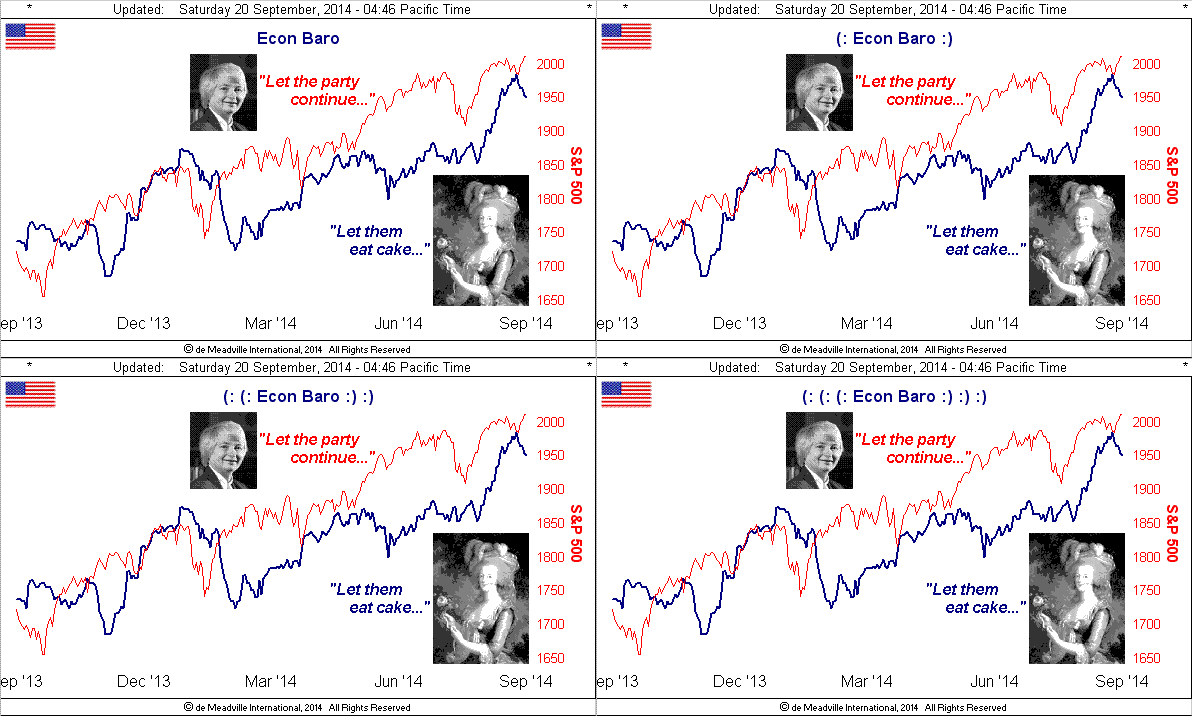
A little infamous "ooh-là-là" there from Queen Marie in the Econ Baro graphic, and why not? Did you happen to catch an item early in the past week that began as follows? (Not by yours truly, yet it well could have been): "Economic soufflé at risk of implosion - The prospect of higher interest rates remains the bête noire of financial markets, judging by their recent performance." --(J. Pelosky, FinTimes). But then, Ms. Yellen quickly soothed Wall $treet's worries. For now.
Indeed as tapering of StateSide Quantitative Easing reaches its full conclusion, the slack is already being taken up elsewhere. The People's Bank of China is set to inject the yuan-equivalent of some $81 billion of liquidity into the country's top banks as the Land of the Dragon's economy falters. The European Central Bank's four-year El Cheapo loans haven't attracted nearly the participation sought, thus inferring more stimuli-manipuli almost certainly to be in the offing, and justifiably so given that Germany's investment sentiment fell in September for the ninth consecutive month.
"And also, mmb, Air France is on strike!"
More newsworthy than that, Squire, is when "Air Chance" is not on strike. (Besides, from first-hand experience, being stranded in Paris for five days is not that bad). Anyway, the point of all this is that the weight of the economic world these days seems not only centered on but indeed is dependent upon America, which in turn is dependent upon all these other economies for our own stuff. And should we suddenly not be able to import enough stuff, yet find it too dear here to manufacture our own stuff, then we're gonna get stuffed: asset liquidation ensues, stumbling prices make the news, QE quickly then renews, and thus is lit gold's rocket fuse.
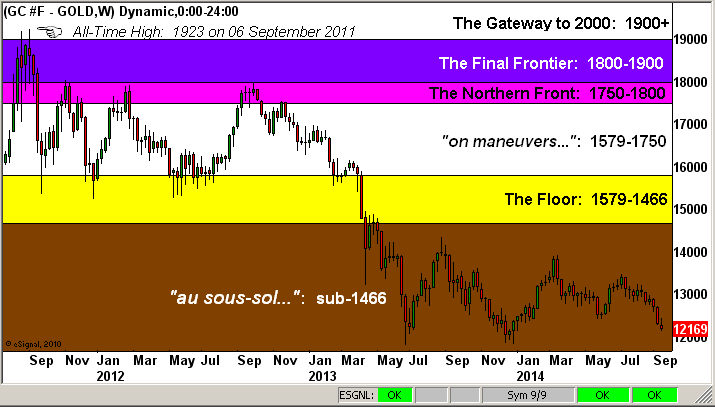
That however, is then, whilst this is now. In the gold structure chart that follows, (a test of the aforementioned 1203 and 1180 lows notwithstanding), we do not wish to see gold dwindle below the bottom of this chart, for to materially so do would change the consolidation pattern that began better than a year ago into a broader-based downtrend. The expression "au sous-sol" refers to gold's already being in the basement beneath "The Floor"; and we don't wish to have to create a further sub-structure for the chart in orangy-red defined as gold having gone to "you-know-where":
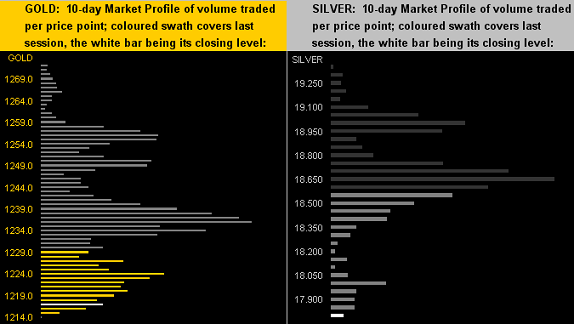
So, as if we haven't already been "finished-off" by metal price fatigue, let's nonetheless finish off with the 10-day Market Profiles for both gold and silver, such that when their respective tides turn back up, you can anticipate the expected price points of near-term hesitancy 'round the major apices as shown:
In closing, let us return from whence we opened, that being with mention of Scotland. Its flag is, of course, that of the Saltire, or Saint Andrew's Cross. We point his out, for to look at the respective linear regression trends of both gold and the S&P 500 since the former's closing All-Time High of 1900 on 22 August 2011, (prior to the intra-day All-Time High of 1923 on 06 September 2011), we daresay the resulting pattern uncannily represents Scotland's flag:
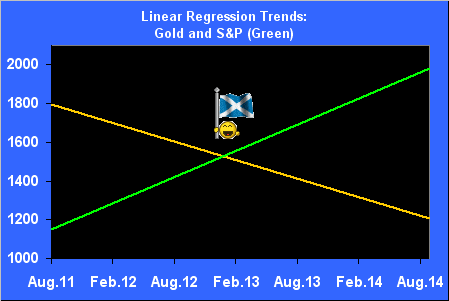
What does it mean? From our perspective, both trends are unsustainable, otherwise (having crunched the numbers) gold would hit zero ("0") in just six years' time whilst the S&P would achieve 3000 in less than four years. 'Tis not gonna happen. So grab a tappit hen of usquebaugh to wash down that haggis right quick such that you'll have the energy to participate in gold's inevitable turnabout!