Talking Points:
- Gold sees outflows due to progress on Greek negotiations
- Copper rose on positive China HSBC PMI
- Oil demand is suppressed despite volatility from July expiry and macro events
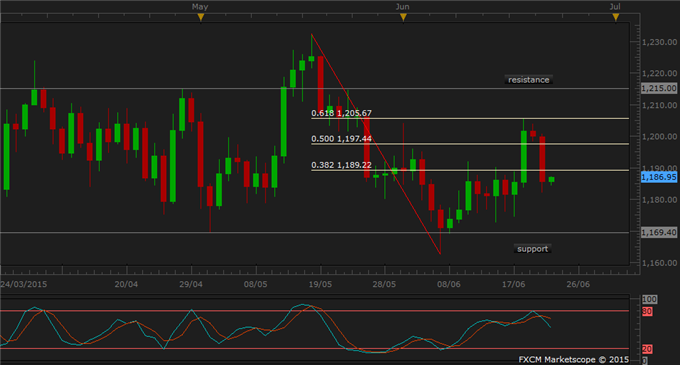
Gold dropped after positive news came out of an emergency Eurogroup meeting, suggesting a new proposal by Greece was met with goodwill by EU leaders, and they are working through a final proposal to submit to European Council on Thursday. Equities broadly rose as a result of this news, attracting flows out of gold and other safe-haven assets. The Euro Stoxx index rose 4 percent, the FTSE 100 added 1.72 percent, Germany’s DAX advanced 3.8 percent and Japan’s Nikkei climbed 1.26 percent. Gold gave back last week’s gains overnight to retreat below the 38.2% Fibonacci retracement at 1189.22 today. Given the current downward bias, a clear break back above this level is not expected today, barring negative developments from Europe.
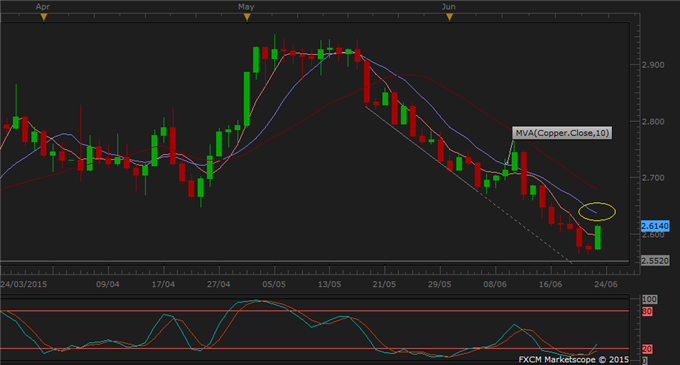
Copper paused ahead of support at 2.5520 for the second consecutive day, and received a boost from the HSBC China Manufacturing PMI report late into the Asian morning. The gauge came in at 49.6 in June versus 49.2 in May (although it is still in the contraction zone while readings are below the 50 dividing line). Momentum signals indicate a rebound may be forming, and attention is currently on topside, with 10 DMA marking resistance at 2.6359. This rise may represent the top of a corrective bounce within the downtrend rather than a shift of direction, as Chinese and global growth remain a concern.
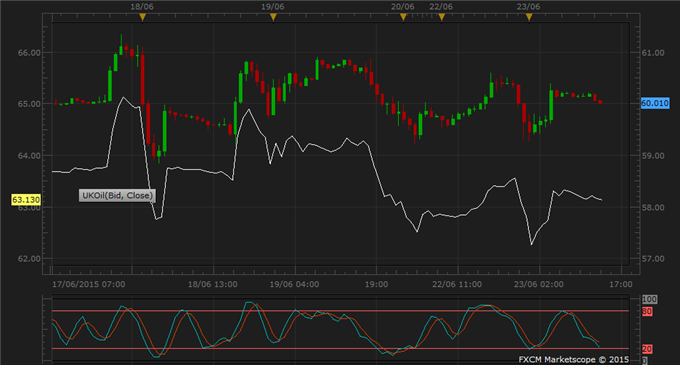
Crude oil initially rose following a Genscape report pointing to a draw of nearly 2 million barrels from the stockpile at the Cushing, Oklahoma delivery hub, before it quickly reversed on worries about a potential fallout from Greek crisis, until short-covering on the last trading day of July futures (22 June) drove it up again. Oil has been flat during the Asian session so far, with little news to detract from the on-going negative outlook regarding oversupply, particularly with an excess in gasoline stocks to nearly 500,000 barrels in the week of 12th June. Gasoline is part of the refinement products market that makes up demands for crude oil. Its futures fell 1 percent, leading the oil complex lower. Oil will likely stay flat and tilted to downside until the EIA’s weekly supply-demand report comes out on Wednesday (US).
GOLD TECHNICAL ANALYSIS – Gold retreated below the 38.2% Fibonacci retracement at 1189.22 today after positive news regarding Greek debt negotiations. A downward bias on the daily chart indicates further sideways moves ahead, barring any news from Europe between now and Thursday, when the European Council meets to finalise a Greece funding deal. The previous low of 1182.07 offers an immediate support level, with multi-month support at 1169.4 following thereafter.

COPPER TECHNICAL ANALYSIS – Copper extended topside after China HSBC Manufacturing PMI came out positive in late Asian morning. A downtrend signal has not yet materialized, so no reversal is expected from the current correction. Immediate resistance is marked by the 10-day DMA at 2.6359, which firmly capped gains during earlier down trend progression and only failed during the June correction. Failure to break above it will be a hint that the down trend is still intact.

CRUDE OIL TECHNICAL ANALYSIS – Intra-day momentum points to downside, although price action remained lackluster during the Asian session. WTI opened at 59.26 today, which is acting as an intra-day support level above last week’s low of 58.71. There is no trade opportunity within this tight range, and traders may wait until a rally towards resistance at 61.79, which may present an opportunity to short.

