The biggest news event of the calendar month is almost upon us and gold will likely see a jump in volatility. But before we get there we could see some technical movements that could push gold to test the recent lows.

Gold retested the lows around the $1,140 mark recently as US dollar strength and speculation of an interest rate hike from the Fed led to plenty of gold selling. The bounce off the support once again validated this level as a strong support zone that will be tough to break. It will be the line in the sand that, if broken, could lead gold much, much lower. But we don’t expect this to be broken any time soon; perhaps when the Fed does finally raise interest rates will we see a proper assault on the support.
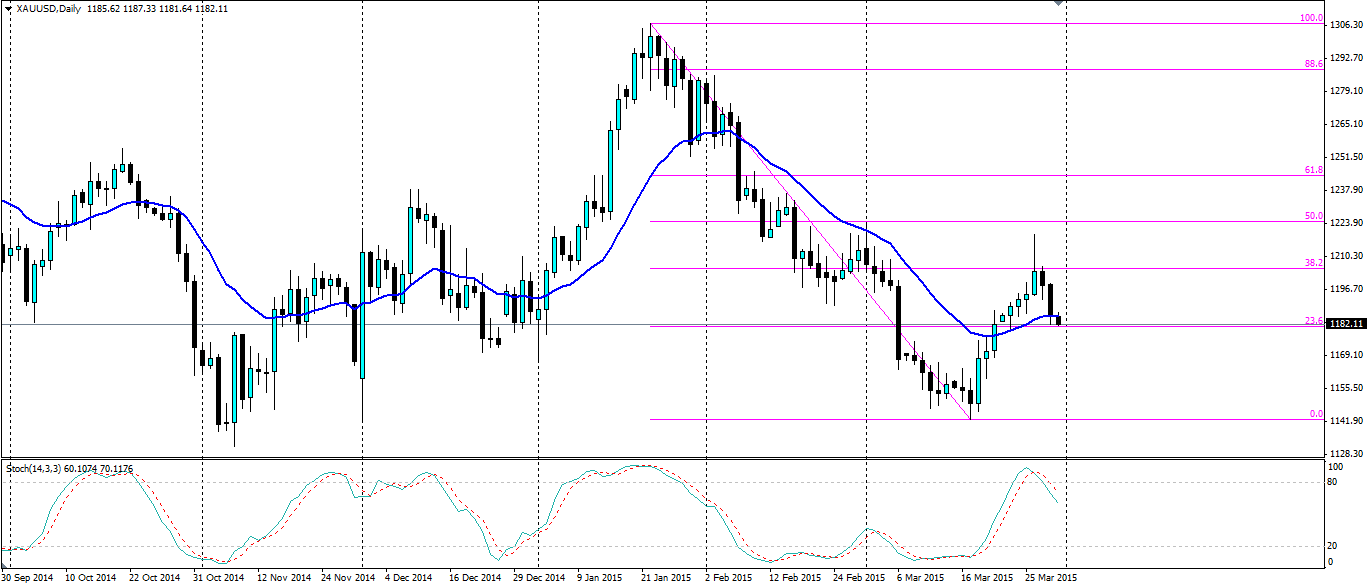
The Fed muddying the waters of just when they will look to raise interest rates led gold higher off the support. The bombing of militants in Yemen by a coalition led by Saudi Arabia also provided support for gold as investors sought safety. This saw a push up almost to the 50% Fibonacci retracement but it stopped short with some decent resistance being found at the 38%. Gold is now using the 23.6% level as support at the well-known $1,180 level.
The Stochastic Oscillator has retreated from overbought, but is still very high, indicating the downward momentum still has further to go. Gold has been trending in rather non-volatile movements recently with the daily chart posting 8 consecutive bullish candles and now three consecutive bearish. Because the momentum is non-volatile, therefore unlikely to swing wildly (at least until the end of the week),this could lead us to a breakout of the support at the 23.6% Fib level.

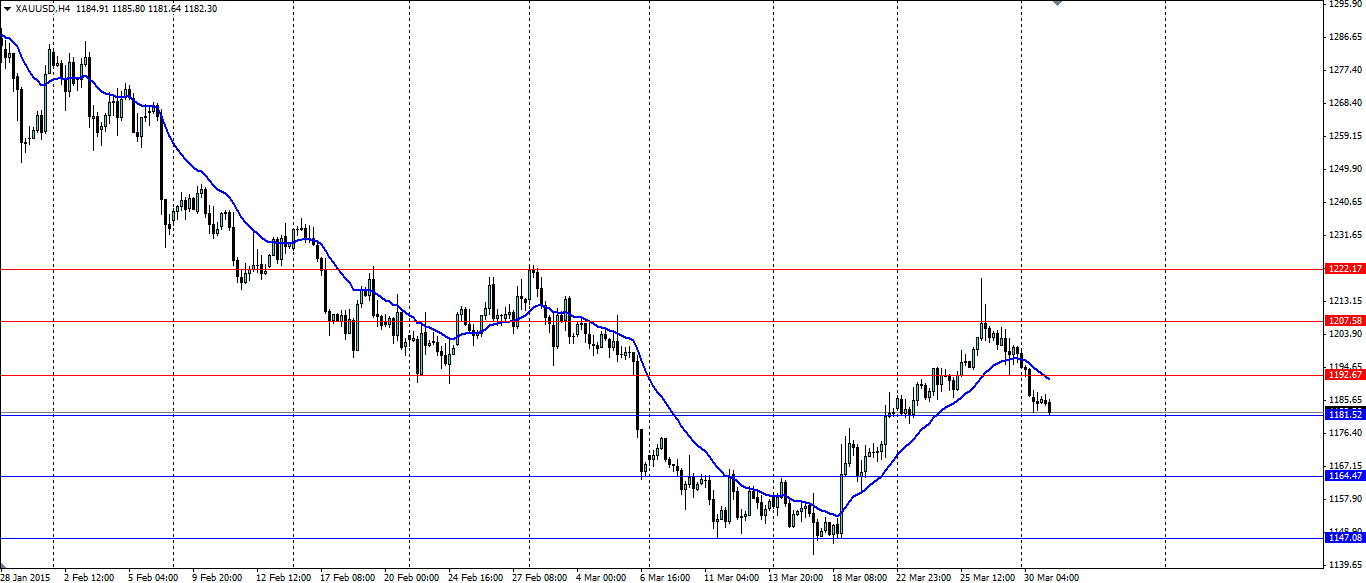
The best way to play this would be to set a stop entry just under the support at the 23.6% level. This will catch the momentum of any breakout as it pushes lower. Look for the first target at the 1164.47 support level with the second target just above the recent low at 1147.08. If we see the 23.6% level hold, Price will look for resistance atthe 1192.67, 1207.58 and 1222.17 levels.
This trade setup could be completely obliterated by the volatility expected on Friday this week when the US Nonfarm payroll figures are released, so pay attention and protect any positions properly. We have consistently seen 200k+ results and this month will likely be no different; gold will certainly turn bearish if the result is strong. The Fed will be watching these figures closely as they will base their rate decision on a number indicators, and Nonfarm is one of them. A strong result will add weight to the case for raising rates so watch this news release.
Gold could see a breakout of the support at $1,180 an ounce which is also a 23.6% Fibonacci retracement level which could see it target the recent lows. Watch out for a spike in volatility at the end of the week as US Nonfarm Payroll figures are released.
