Get 40% Off
🚨 Volatile Markets? Find Hidden Gems for Serious Outperformance
Find Stocks Now

Bearish Gold Set To Move Lower; $870 In View Longer-Term

Published 08/10/2015, 07:45 AM
Updated 07/09/2023, 06:31 AM

Gold Monthly

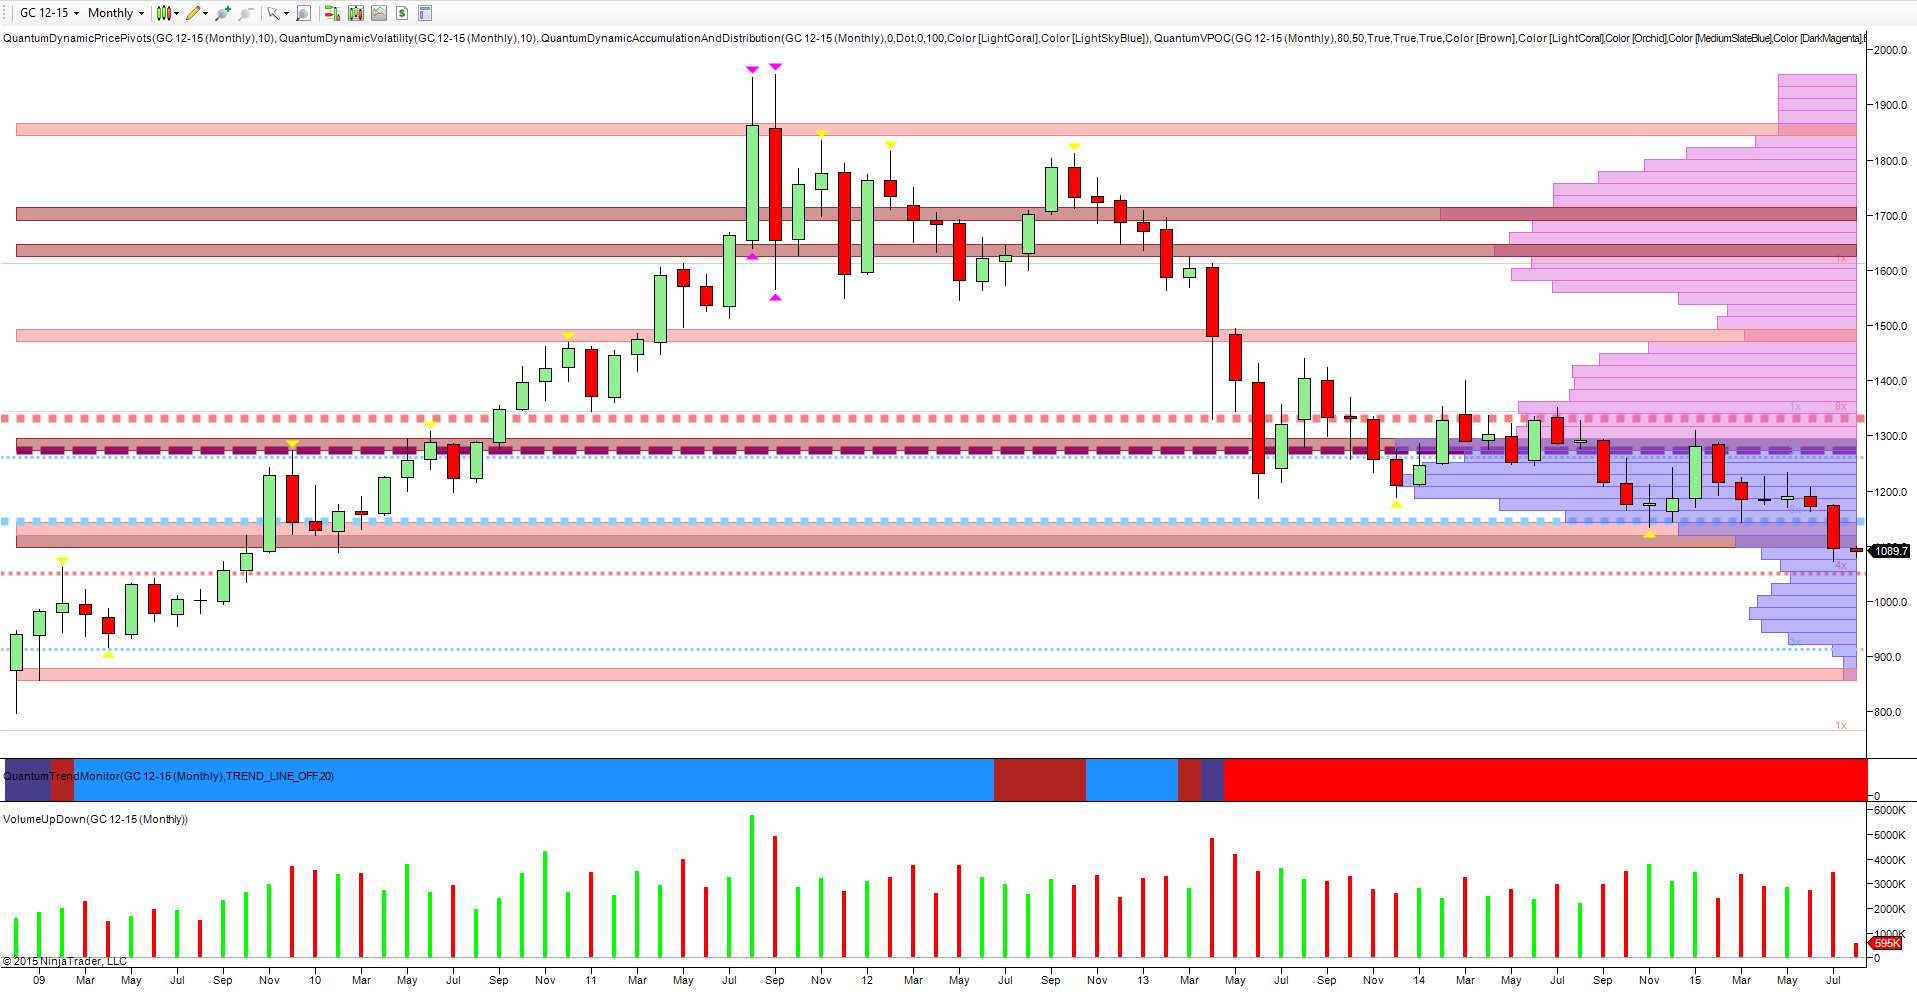
Like oil, gold is another commodity where the longer term perspective not only helps to place the current bearish picture in context, but also highlights more clearly where the metal is heading longer term. So in this case, let’s start with the monthly chart from which several things are self evident.

Last month’s price action was pivotal for three reasons. First, and perhaps most significant, it broke through and closed well below the deep region of accumulation as denoted by the blue dotted line in the $1140 per ounce area. Second, the wide spread down candle closed below the high volume node of the VPOC in the $1100 per ounce area. And third, the price action finally broke away from the extended congestion phase of the last few months.

Furthermore, with the fulcrum of the volume point of control now perched in the $1270 per ounce region, this is adding additional downward pressure to an already heavily bearish chart. Indeed, the way is now open for gold to drop toward the low volume node in the $870 per ounce area, and with little potential support available, this now seems increasingly likely longer term.

Looking at the volume at the bottom of the chart, there is little to suggest any buying interest whatsoever. If and until we see a buying climax in this time-frame, one fully supported by the big operators, then gold looks set to continue its stately progress lower, back to three figures.

Gold Weekly

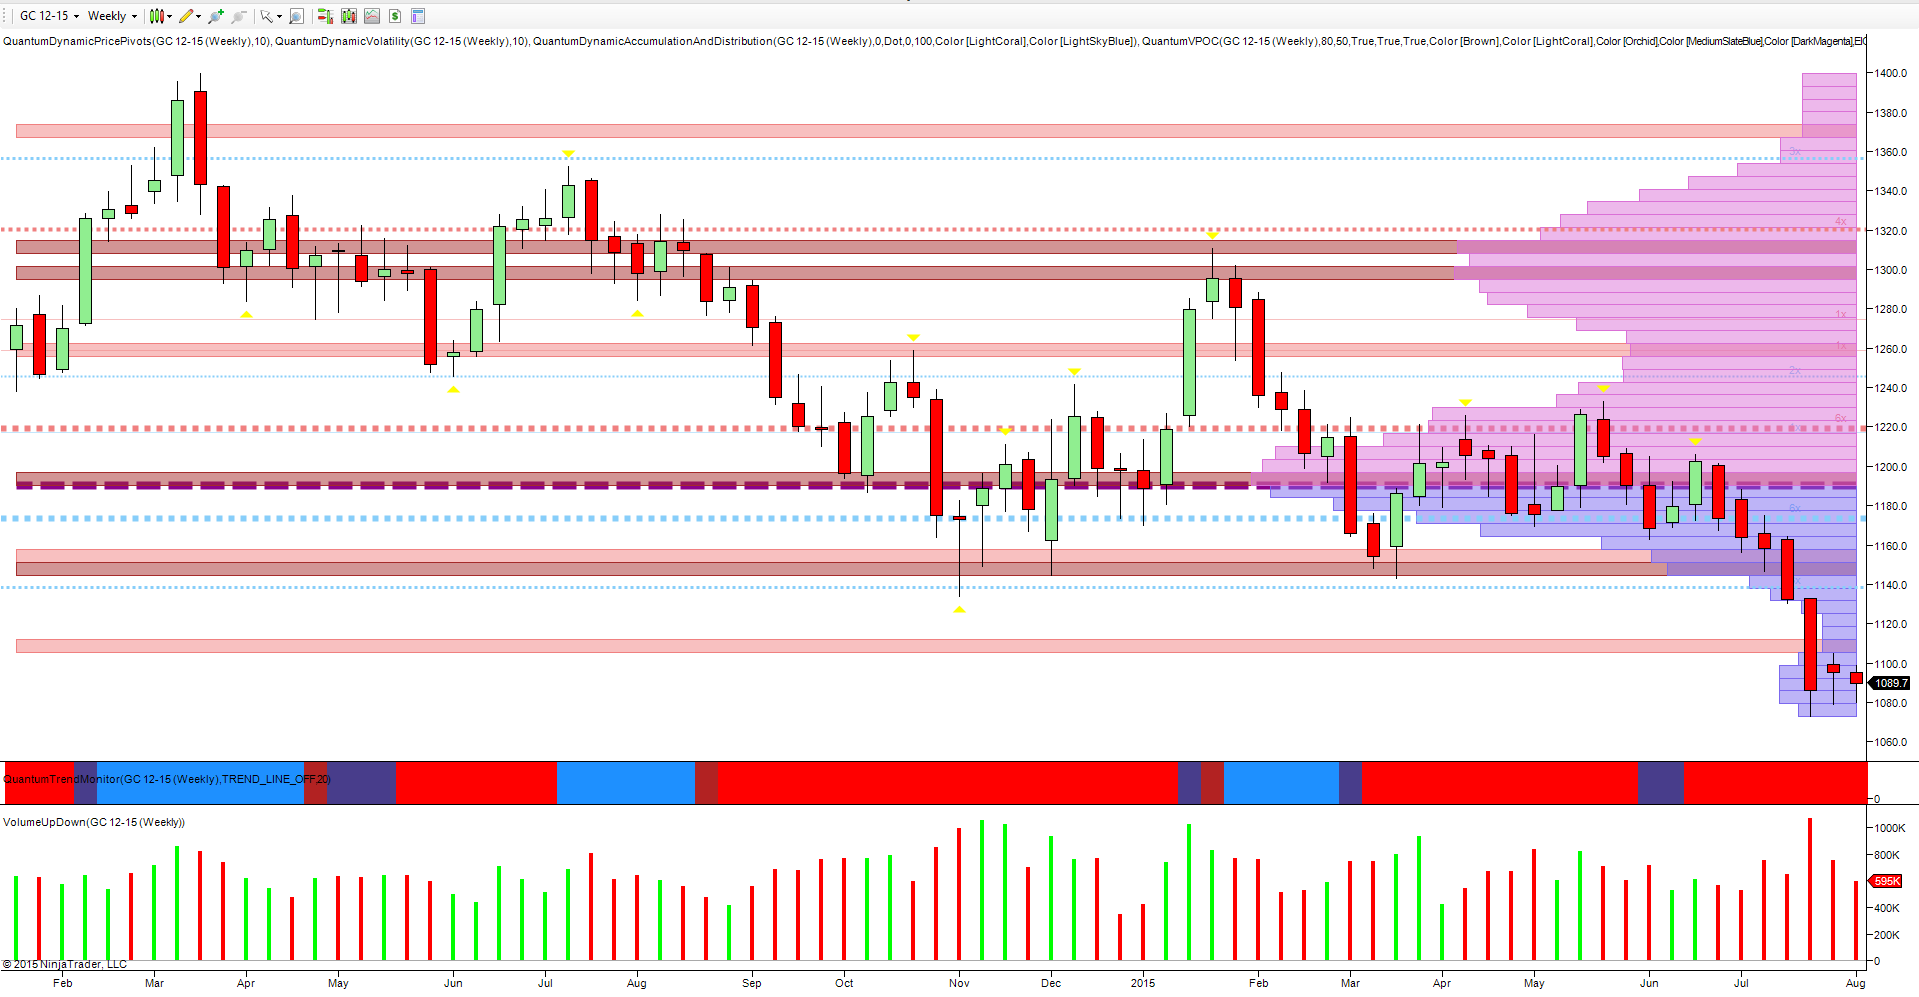
Moving to the weekly chart, in the last two weeks we have seen a modicum of buying at this level, but not sufficient to reverse the longer term trend. With the wide spread down candle of three weeks ago moving rapidly through the low volume node of the VPOC as expected, accompanied on high volume, here too the picture looks bearish.

3rd party Ad. Not an offer or recommendation by Investing.com. See disclosure here or remove ads .

Gold Daily

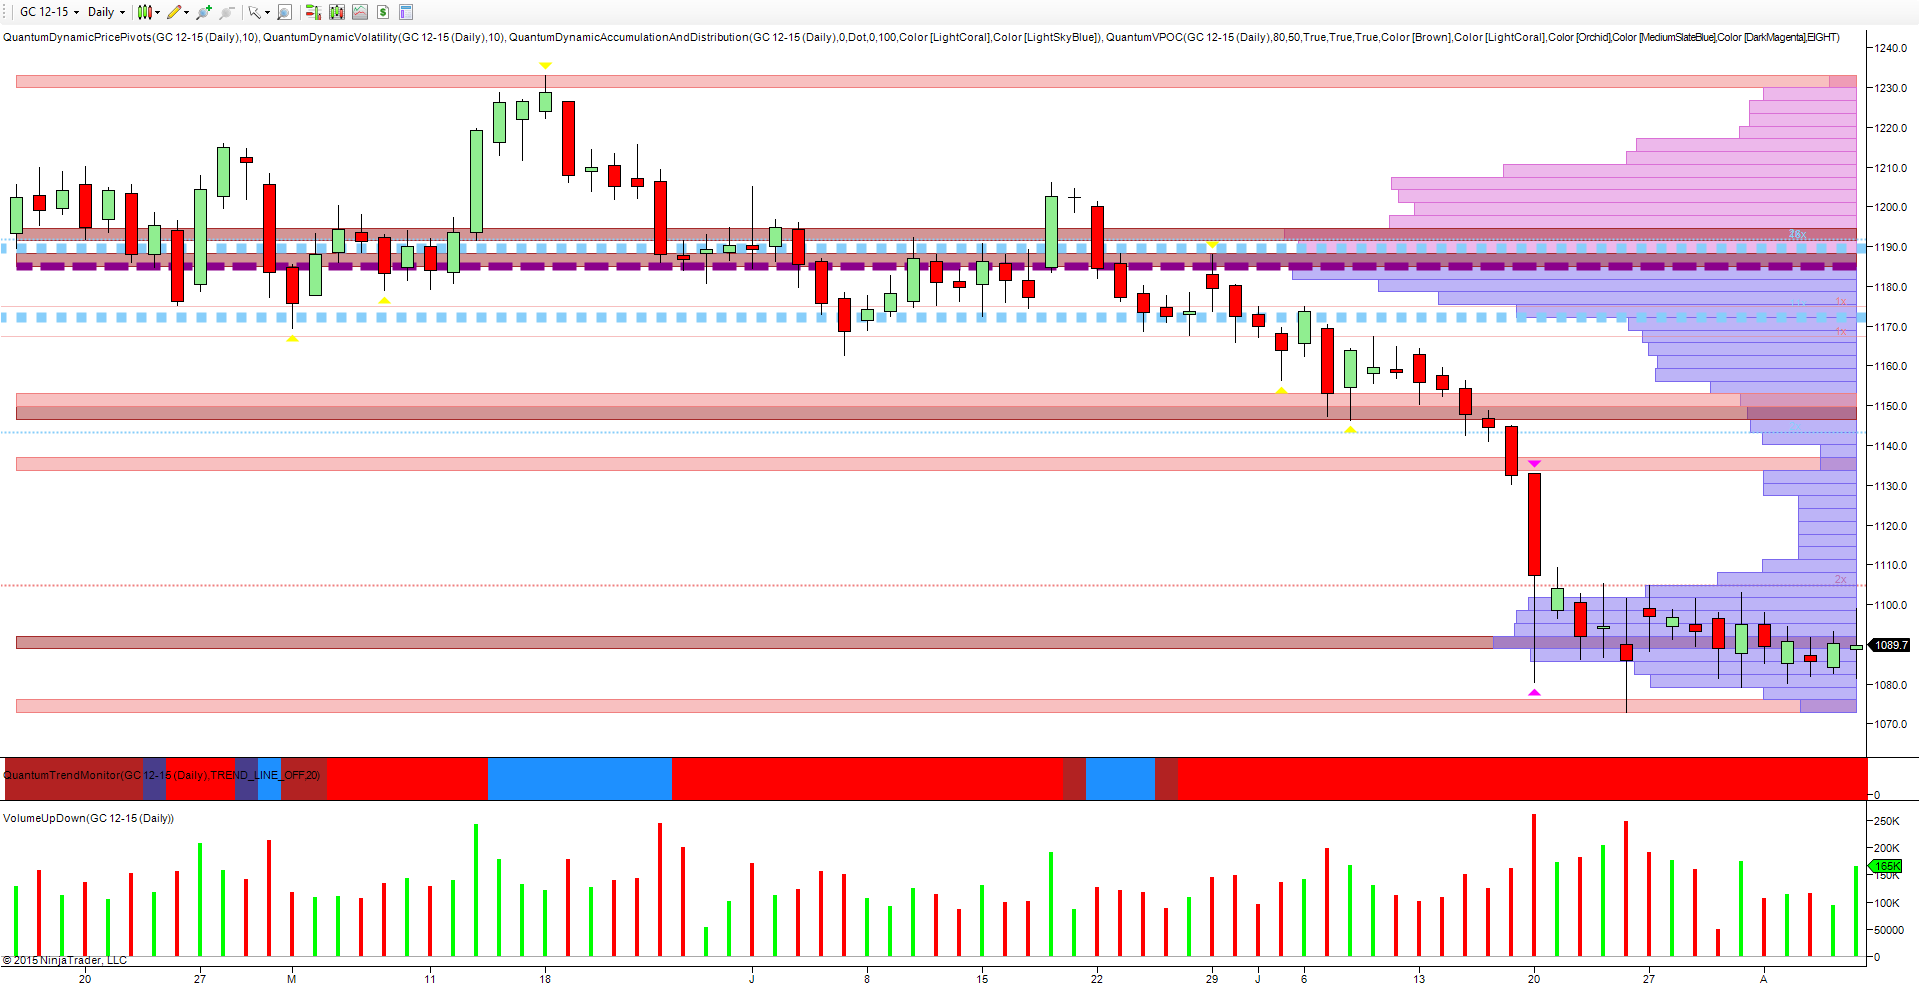
Finally to the daily chart, where the price action since late July has oscillated around the high volume node of the VPOC in the $1090 per ounce region. Any breakaway from this level will likely see gold prices move rapidly through the low volume node below in the $1075 per ounce region before accelerating lower once again.

Latest comments

Risk Disclosure: Trading in financial instruments and/or cryptocurrencies involves high risks including the risk of losing some, or all, of your investment amount, and may not be suitable for all investors. Prices of cryptocurrencies are extremely volatile and may be affected by external factors such as financial, regulatory or political events. Trading on margin increases the financial risks.
Before deciding to trade in financial instrument or cryptocurrencies you should be fully informed of the risks and costs associated with trading the financial markets, carefully consider your investment objectives, level of experience, and risk appetite, and seek professional advice where needed.
Fusion Media would like to remind you that the data contained in this website is not necessarily real-time nor accurate. The data and prices on the website are not necessarily provided by any market or exchange, but may be provided by market makers, and so prices may not be accurate and may differ from the actual price at any given market, meaning prices are indicative and not appropriate for trading purposes. Fusion Media and any provider of the data contained in this website will not accept liability for any loss or damage as a result of your trading, or your reliance on the information contained within this website.
It is prohibited to use, store, reproduce, display, modify, transmit or distribute the data contained in this website without the explicit prior written permission of Fusion Media and/or the data provider. All intellectual property rights are reserved by the providers and/or the exchange providing the data contained in this website.
Fusion Media may be compensated by the advertisers that appear on the website, based on your interaction with the advertisements or advertisers.
© 2007-2024 - Fusion Media Limited. All Rights Reserved.