The "Big News" presently making the rounds is the "Big Drop" in StateSide payroll creation for the month of March, the number (126,000) being some 50% below that anticipated by expert economists coast-to-coast, et alia. More revelation on that in a moment, but first, the "Big News" 'round here is that in having passed March's end, and now already being a few trading days into April, we've still a Precious Metals' component of the BEGOS Markets that is leading their 2015 performances, and by quite a margin at that. Hats off once more to Sister Silver! Here are the year-to-date Standings through the abbreviated trading week ending Thursday, 02 April. And comparatively, what a difference a year makes, eh?
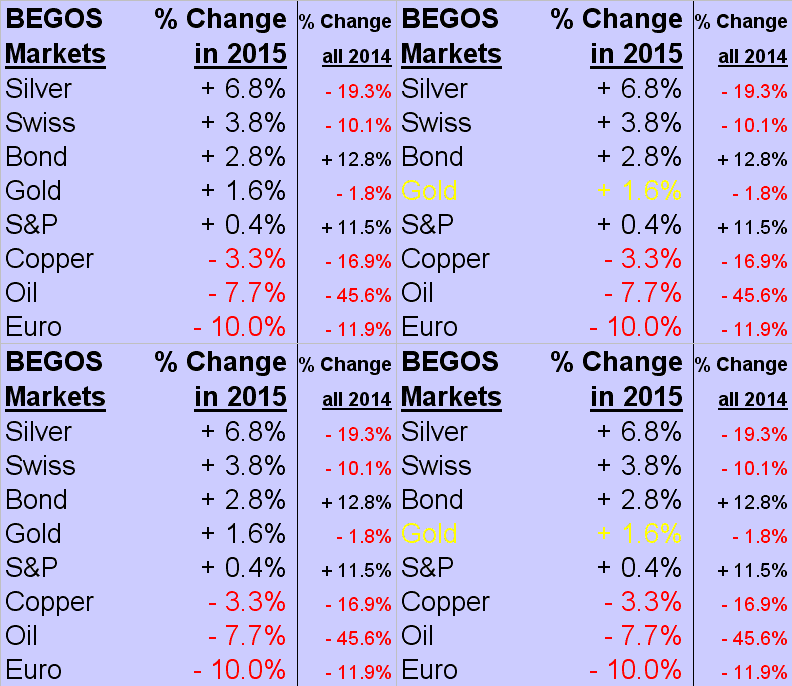
In fact, one arguably might restate the S&P 500 from being +0.4% to instead being -0.6% given yesterday's (Friday's) sharp post-payrolls selloff in the S&P futures (the equities markets themselves being closed); come Monday, we'll see how 'twill all being resolved. Gold, too, was closed Friday, however in trading via the Rupee earlier today in India's Saturday bullion market, the yellow metal closed higher such as to approximately translate to a Dollar price of 1221, up from Thursday's GLOBEX settle of 1203.
And rightly ought the slowing payrolls' data resolve positively for Gold, for specific to this "unexpected" (really?) decline in payroll growth, consider the following: if 'tis the mandate of the Bureau of Labor Statistics to put out the best number up with which it can come -- and given that 126,000 was all that could be mustered -- it seems to give justification to the rampant pullback we've been witnessing in the Economic Barometer since its having peaked almost four months ago on 11 December:
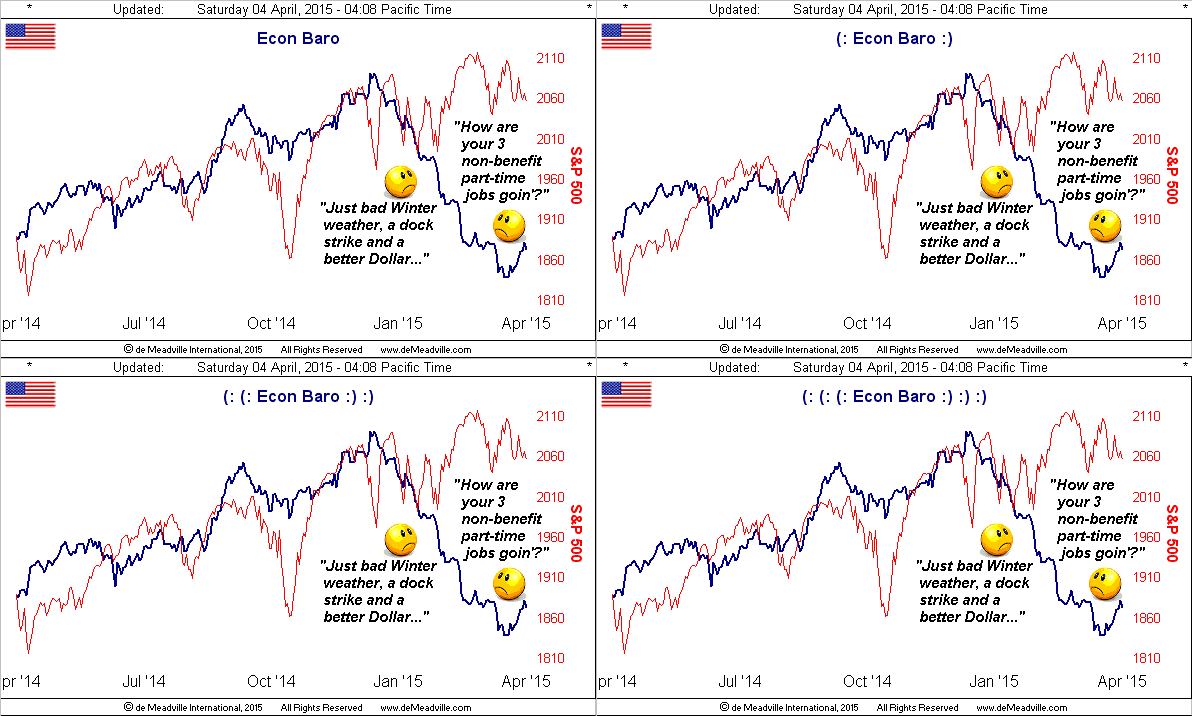
Why even the persistent FinMedia flag-waving is suddenly sensing it, one of their headlines this past week noting that "America's economy is starting to see cracks..." Moreover, with respect to an "expected" interest rate rise by the Federal Reserve Bank, the clarion cry for the increase's coming in "June!" is now morphing into "September!" Further, in speaking yesterday on separate occasions with two of our essentially charter readers, both said "Not this year!" Yet in spite of it all, 'twas reported during the week, per the National Association for Business Economics, that a panel of business economists are predicting robust growth for the U.S. economy this year. We're not sure of that at which they're looking, but their economic brethren certainly just fell pell-mell into the payrolls' pothole. Nice work.
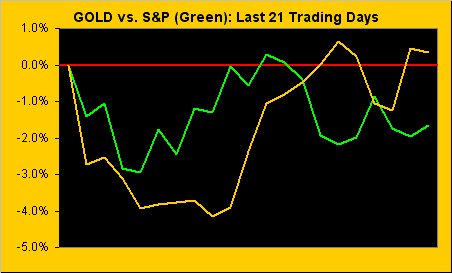
Whilst the stock market on balance has ignored the above Econ Baro's plummeting, Gold (despite its on-going flip-flipping across the 1200 level), is maintaining a bid, and is showing signs of again trading in inverse correlation to the S&P. Here are their respective percentage tracks from one month ago-to-date, (the green S&P line not incorporating Friday's plunge, given that Gold was closed and thus could not comparatively react):
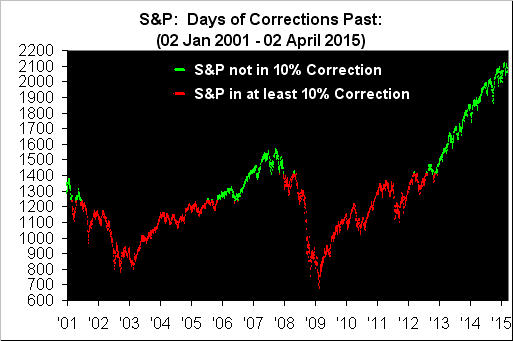
Indeed, seeing the StateSide economy's running out of puff, expectations of a mediocre Q1 Earnings Season, and the spectre lurking out there of an interest rate rise, is it just me, or are you too, hearing more whispers of "correction" for the stock market? To be sure, the S&P has not closed 10% below any all-time high achieved since 04 December 2012. In fact, we would caution your sharing this next graphic with your friendly neighbourhood stockbroker, (in the interest of their cardiac health). Here below are the 3,584 daily closes of the S&P 500 from millennium to date; when the line is red, the Index is at least 10% below whatever its all-time high has been to that date. Scary, non?
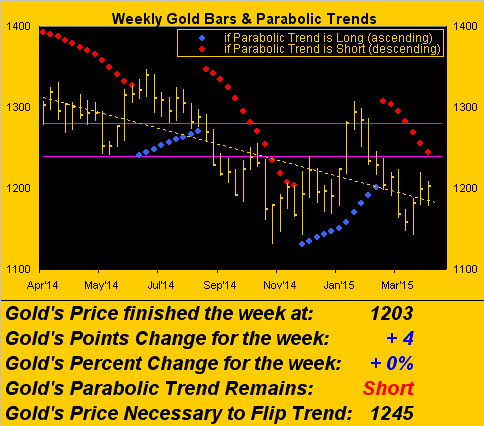
As to the past week, Gold again proved to be resilient, albeit first getting hammered right out of the chute on Monday, but then recovering in full through Thursday, (again at this Saturday writing, not able to react to Friday's March payrolls' data report after which the S&P futures went -1.0%). But the poor payrolls' growth is another reason for Gold to rise. And, as mentioned earlier, today's trading via the Rupee is suggesting a pop to 1221, which if confirmed when markets re-open in the new week means the parabolic Short trend in the below chart of Gold's year-over-year weekly bars is becoming short-lived, as price would rise toward eclipsing the declining red dots:
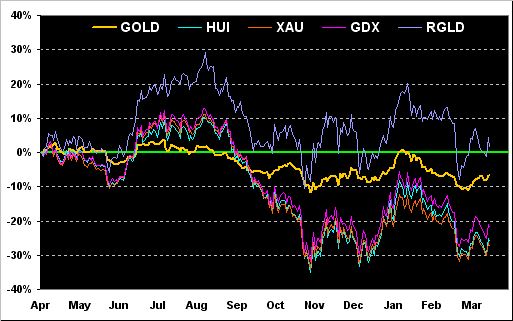
Again year-over-year, here next are the percentage performances of Gold alongside those of its equities groupings, namely the HUI (Gold Bugs Index), the XAU (Philly Exchange Precious Metals Index), ARCA:GDX (the exchange-traded fund of senior miners) and NASDAQ:RGLD (the oft-rollickin' royalty company Royal Gold). Across the slate, hardly impressive, indeed rather depressive, performances:
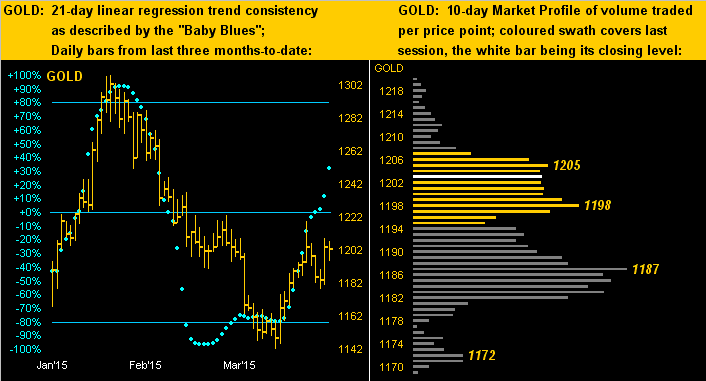
That being said, we're getting some nicer near-term perking up in Gold's "Baby Blues". On the left in the following two-panel graphic we've Gold's daily bars for three months-to-date with the blue dots -- which depict 21-day linear regression trend consistency -- continuing their ascent. On the right is Gold's 10-day Market Profile, with just some wee resistance at 1205, and support at 1198, 1187 and 1172:
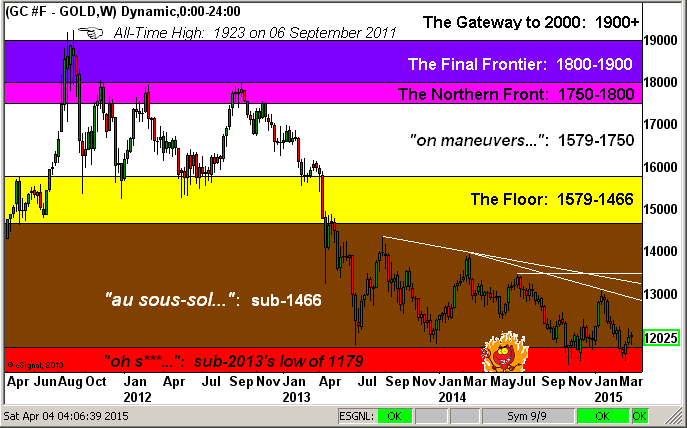
For our final graphic, from the "Facing the Facts Dept.", since Gold's All-Time High of 1923 on 06 September 2011, the below overall Structure Chart remains hum-drum glum. But we've added thereon a few white lines that point toward the high 1200s to mid-1300s as major hurdle area above which to reach. The conditions are ripe to so do, (debasement, repatriation, geo-jitters, waning economies leading to more monetary stimulus, etc). It does beg the question: which will be the first investment bank to comment upon their "lightening up on equities exposure and shifting at least a bit more portfolio monies into Gold"? It shan't take much more than that to turn the tide as the others then pile on:
Now in parting, here are three quick notes:
1) We read this past week that during March, companies struggled in China and on balance across Asia, the notion being a resorting to more stimulus from their respective central banks. Bring it on!
2) The Federal Open Market Committee's meeting minutes from the "patience"-lacking 18 March Policy Statement will be released on Wednesday (08 April). To be sure, we already witnessed the gentle calming in the press conference. But recall that 1984 mega-hit from Prince ![]() "When Doves Cry"
"When Doves Cry"![]() ? We'll see!
? We'll see!
3) Finally there's this property-values wrecker: a Minnesota emergency management official warned a few hundred residents living near a rail line in Douglas County to be prepared for a train accident whenever North Dakota crude oil goes zooming by. I guess if instead 'twere cattle, 'twould be OK. How about Gold!