Get 40% Off
🤯 Perficient is up a mind-blowing 53%. Our ProPicks AI saw the buying opportunity in March.Read full update

Gold Futures About To Break Out, But In Which Way?

Published 05/26/2014, 08:29 AM
Updated 07/09/2023, 06:32 AM

The Daily chart of June Gold Futures below shows the market has been trading in a very tight range (relatively to gold) since March 25th. Markets go between periods of low volatility/tight ranges to high volatility/ wide ranges. One common tool traders use to measure it, is the ATR (Avg. True Range) which hit its lowest point since January of this year.

Two main questions traders have: What way will the breakout take place? And, when?
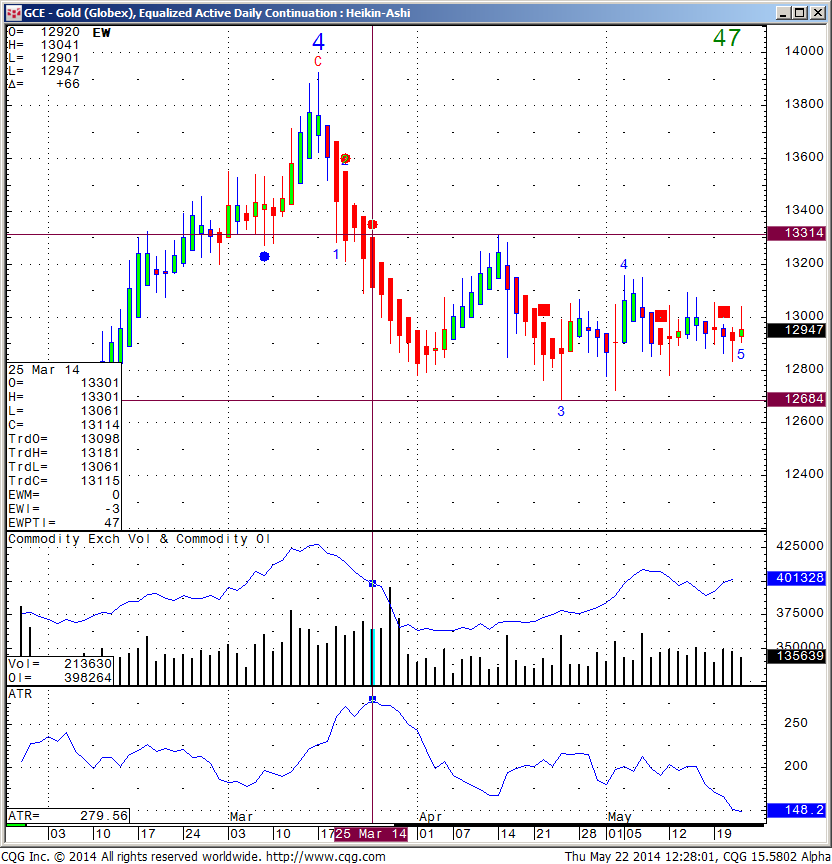


GCE Daily Chart


The last period of low volatility/tight range took place between Nov. 21st 2013 and Feb. 10th 2014, approximately 80 days. This period of low volatility started March 25th 2014 which puts us around June 8th to June 18th for possible timing break out. To be honest that part of the equation does not concern me as much as the main question, which way?

To answer that I need to go into higher time frames of the chart and will take a look at the weekly chart which provided the first bullish signal ( first blue circle after many red circles) in a while back in February as we broke out of the previous range.
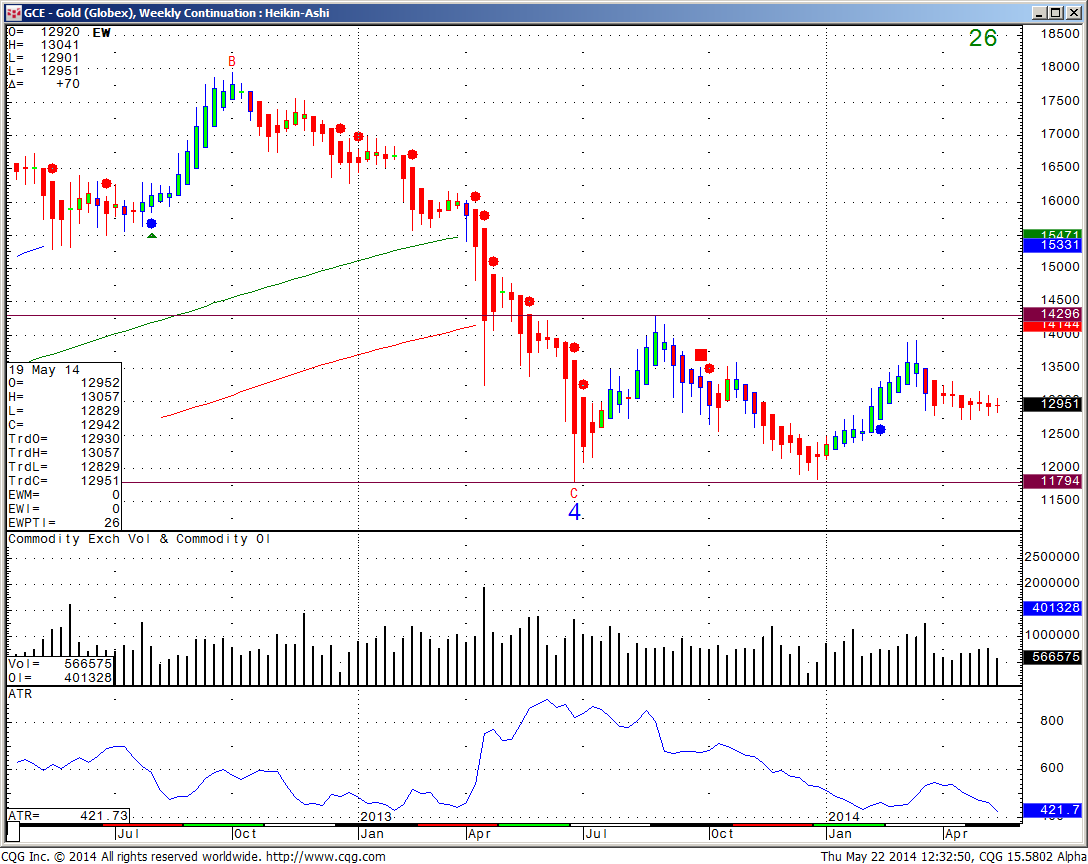


GCE Weekly Chart

So at this point I am facing an equal case for both bulls and bears and will have to resort to the "good, old method of volatility breakout". Knowing that there good arguments for the bulls as well as the bears, I would monitor a break above 1332 or a break below 1268 before trying to establish any meaningful, longer term position using options or futures targeting the previous weekly ranges as seen above.

3rd party Ad. Not an offer or recommendation by Investing.com. See disclosure here or remove ads .

Latest comments

Risk Disclosure: Trading in financial instruments and/or cryptocurrencies involves high risks including the risk of losing some, or all, of your investment amount, and may not be suitable for all investors. Prices of cryptocurrencies are extremely volatile and may be affected by external factors such as financial, regulatory or political events. Trading on margin increases the financial risks.
Before deciding to trade in financial instrument or cryptocurrencies you should be fully informed of the risks and costs associated with trading the financial markets, carefully consider your investment objectives, level of experience, and risk appetite, and seek professional advice where needed.
Fusion Media would like to remind you that the data contained in this website is not necessarily real-time nor accurate. The data and prices on the website are not necessarily provided by any market or exchange, but may be provided by market makers, and so prices may not be accurate and may differ from the actual price at any given market, meaning prices are indicative and not appropriate for trading purposes. Fusion Media and any provider of the data contained in this website will not accept liability for any loss or damage as a result of your trading, or your reliance on the information contained within this website.
It is prohibited to use, store, reproduce, display, modify, transmit or distribute the data contained in this website without the explicit prior written permission of Fusion Media and/or the data provider. All intellectual property rights are reserved by the providers and/or the exchange providing the data contained in this website.
Fusion Media may be compensated by the advertisers that appear on the website, based on your interaction with the advertisements or advertisers.
© 2007-2024 - Fusion Media Limited. All Rights Reserved.