Too many technical analysts dismiss fundamentals. True, technicals usually lead fundamentals, but understanding the fundamental drivers (when it comes to gold) can give you an edge.
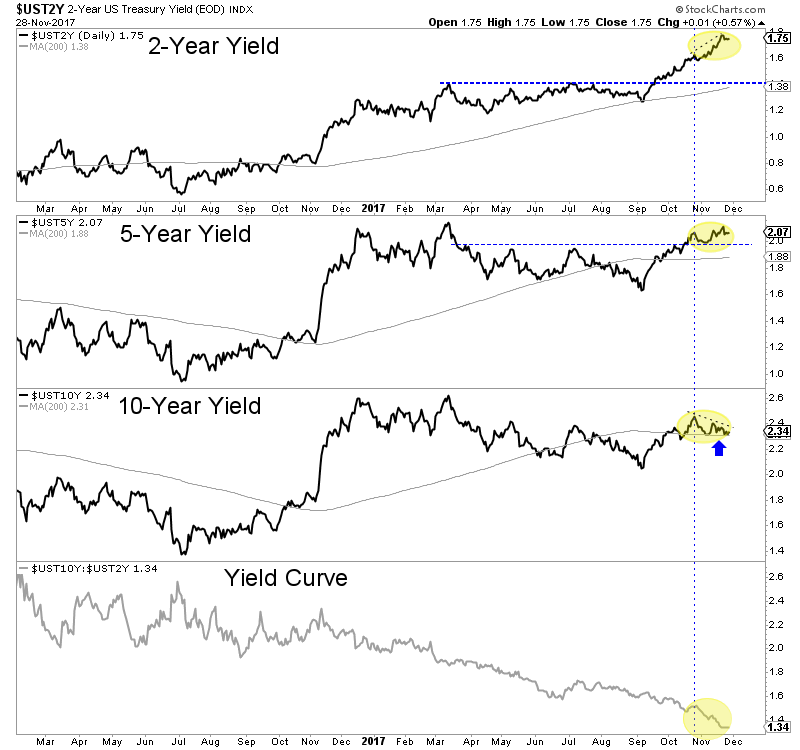
Gold and gold stocks have remained below their 2016 peaks even in the face of a very weak US dollar because the fundamentals are not there. Real rates have been stable in 2017 while the yield curve has been flattening. Until things change, gold and gold stocks have little chance to break out.
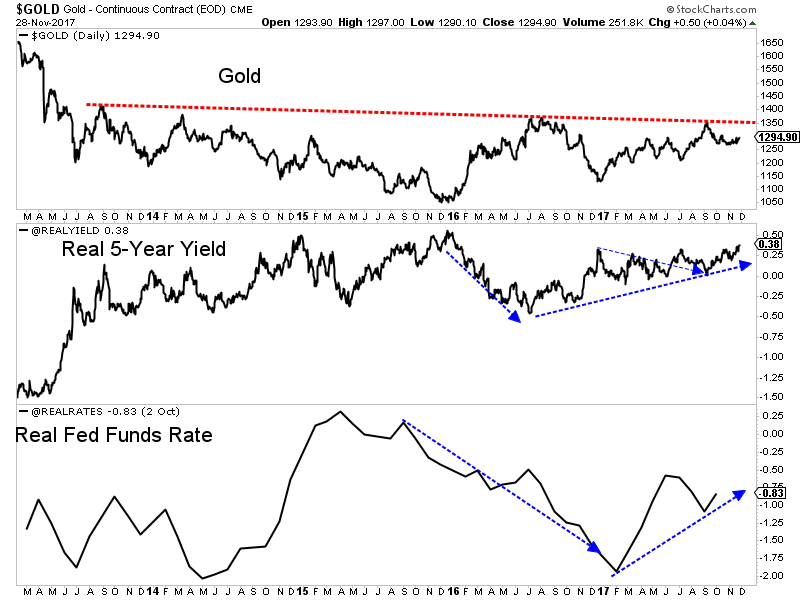
If you follow my work you know that there is a strong inverse correlation between the gold price and real interest rates. Gold performs best when real rates are declining and especially when real rates decline while in negative territory. Real rates declined sharply into and during 2016 but have been rising or stable this year. The current problem for gold is nominal yields have trended higher and faster than the rate of inflation.
In the chart below we plot gold, the real 5-year yield (as calculated from the TIPS market) and the real Fed Funds Rate (rFFR). The US Treasury provides daily data of the real 5-year yield and we can see that it has trended higher since summer 2016 and is currently at its highest levels since Q1 2016. It has advanced nearly half a percent since its low a few months ago. Meanwhile, the rFFR has increased by more than 1% this year. That was after falling by nearly 2%.
As we discussed weeks ago, a steepening yield curve (caused by falling short-term rates or rising long-term rates) is bullish for gold. Some gold bugs are excited about a flattening yield curve as it could lead to inversion. While this may be true, a flattening curve is not bullish for gold.
Below we see that the yield curve continues to plunge (flatten) as the 2-year yield has surged and the 10-year is at the same level as two months ago. A bullish development for gold would be the 5-year and 10-year yields exploding above their March 2017 highs while the 2-year yield arrests its torrid rise.

Gold and gold stocks are going to continue to struggle until the fundamentals align bullishly. Market action will of course lead fundamental changes but knowing the drivers to look for can help us anticipate the fundamental changes in advance.
We think rising inflation is more likely than falling short-term rates to be the driver for gold in 2018. In that case, we would anticipate hard assets to perform better, long-term rates to rise faster than short-term rates and inflation to outpace short-term rates.
These things would sustain gold beyond just a few months. In the meantime, the key for traders and investors is to find the companies with strong fundamentals and seek oversold situations with value and catalysts that will drive buying.

