
'Tis a dubious title, to be sure, gold's having been up as much as +29.9% year-to-date, but per Friday's settle at 1135, now up only +7.0% in 2016. Justifiably, a more descriptive title ought be "Gold Four Sessions Away from its Second-Worst Half-Year This Millennium".
And that is the truth: July-to-date, gold is -14.3%, toward its second-worst half-year performance in this Third Millennium only to 2013's January-through-June run of -26.3%. Not that it adds any healing to the wounds of those who purchased gold at far higher levels this year, but it does beg the question: what was gold's best half-year performance since the end of 2000? 'Twas the 2007 July-through-December run of +28.7% ... just in case you're scoring at home; (this year's +29.9% stint exceeded the half-year timeframe).
Either way, with now just four trading days left in the year's balance, what with "position-squaring" and "Smart Aleck Short Antics" surely to be on display, who knows where gold shall settle out 2016: 'twould be nice to pen in a week's time — in the face of a dollar index +4% and an S&P 500 +10% — that gold nonetheless finished 2016 in the black as well: conventional wisdom says that's not supposed to happen.
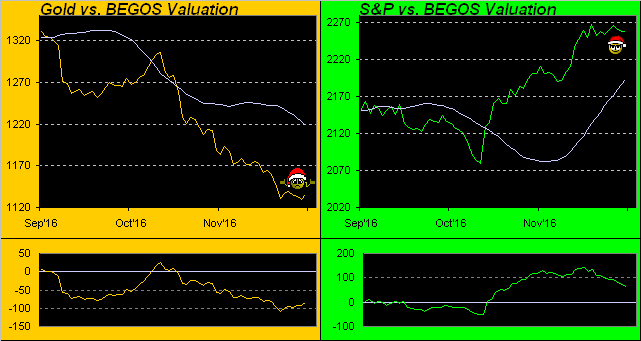
Moreover, if you've been peeking in on the website's Market Values page, you're aware that gold remains unduly "low" and the S&P unduly "high" vs. their respective BEGOS Markets (Bond / Euro / Gold / Oil / S&P) valuations as shown by the smooth, pearly lines in the below panels. The time frame is the last three months-to-date, the oscillator at the foot of each panel depicting price's difference from valuation.
Valuation is the regressive calculation of a specific market's movements relative to those of its other BEGOS peers; thus you can see how "out-of-whack" pricing has been of late per valuation, gold on the left having just been some 100 points "too low" and the S&P on the rightsome 100 points "too high":
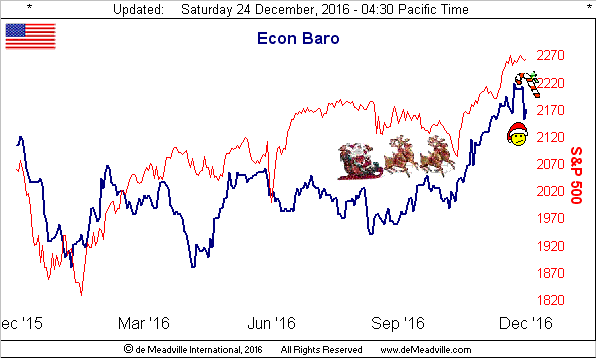
Speaking of "too high" we've been marveling these past two months over the accelerative leap in the Economic Barometer, (its being quite coincidentally so in leading up to the State Side elections). Indeed, as noted a week ago, the "revisions" to past data going forward may be very interesting. Santa may have arrived early for the Baro and Wall Street, but that's a fairly severe "doink" in the data just reported this past week.
Therein, Personal Income declined from +0.5% in September to 0.0% for October, Personal Spending from +0.4% to +0.2%, Leading Indicators from +0.1% to 0.0%, and Durables Orders from +4.8% to -4.6%. But 'tis all just fine, as Q3 Gross Domestic Product was finalized at a +3.5% annual growth rate. Right:
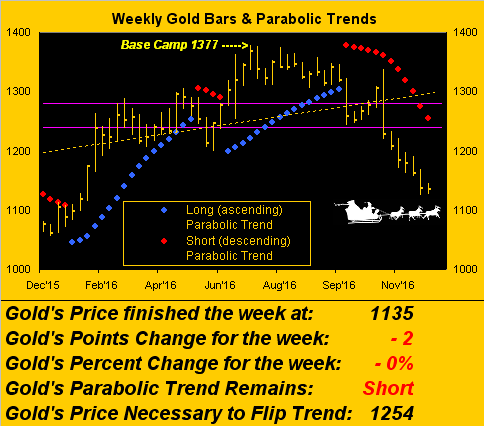
Returning to gold, we've not understated its meriting the "Doink of the Year" award. But as we see below per the weekly bars, gold's yielding a bit such as not to hinder Santa's path can be noble cause for price to base right here and close out 2016 with an upside flurry, 'specially if those aforementioned shorts opt for their winter long johns. Note as well that the descending red dots of the current parabolic short trend are passing through the purple-bounded 1240-1280 resistance zone, meaning that upon flipping to gold's next parabolic long trend, price will then still have to deal with that hardened area:
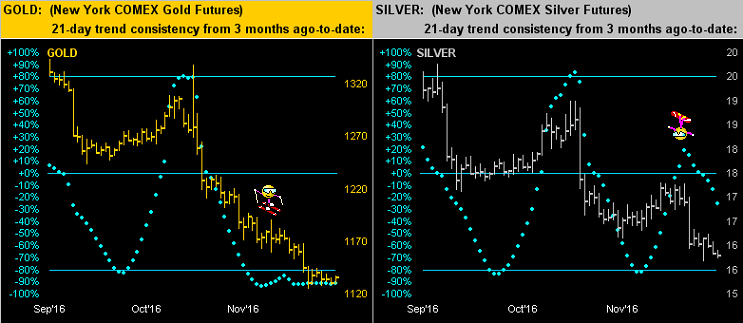
To the "Baby Blues" we next go over the last three months-to-date for both gold (at left) and silver (at right), the blue dots designating the day-by-day consistency of each market's 21-day linear regression trend. And we don't really need gold's blues being below their -80% line to know just how consistent this down run has been, whereas Sister Silver's blues did give her an aerial upside flip before succumbing to the industrial metal downside pull of Cousin Copper during these last two weeks:
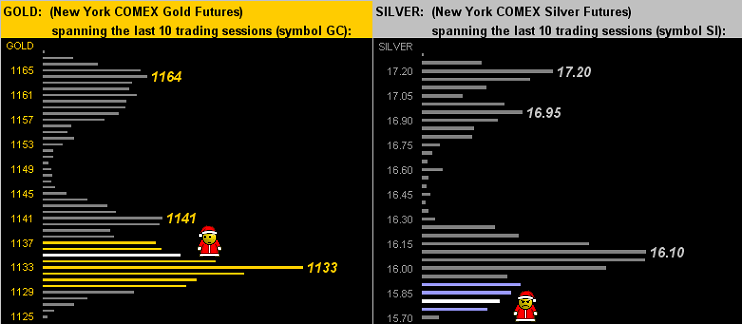
As for the two precious metals' 10-day Market Profiles, gold (below left) rather skeptically is sitting just above the broad 1133 supporter, which is on balance positive given the bulk of contract trading having gone off at that price without materially further damage. However, silver (below right) was not able to maintain her key 16.10 supporter, which is on balance negative given her Baby Blues in the previous chart still have plenty of room to fall. Here are the respective profiles, the white bar is each one denoting Friday's settle:
So: we're but one week away from our year-end wrap for gold, which has a tendency to firm rather than fail over the final four trading days of the year. Millennium-to-date, gold has had but one year wherein the last four trading days netted a loss of more than 2%: 'twas in 2011 (-2.6%) as gold receded from its all-time high of 1923 on 06 September. In fact, in the 15 years since the millennium's turn, gold has netted a final four-day loss just four times (2004, 2009, 2011 and 2015).
In five other years, gold has finished with a four-day flurry of better than +2.5%, the best being 2008's final-four finale of +4.3%; were that to be repeated in these next four days, gold would complete 2016 at 1183. I know, that doesn't say much given gold's having tapped our projected 2016 high up there at Base Camp 1377 back on 06 July... sigh ...
In anticipation of our visit with you in a week's time, we've these few closing notes:
- Given the rather imperiled state of the Italian banking sector, the PIIGS nations' parliament having approved a €20 billion banking bailout bill, one ought think gold to have received more of a boost;
It's that dollar strength, mmb...
Squire, I though you were off to ski Chamonix...
I'm on today's 14:40 AF083 to Paris, mmb...
Well, as they say, "Break a leg"... In any event, the dollar put in a rather lackluster week last week; perhaps 'tis finally running out of puff.
- Besides, with further respect to the PIIGS, Italy's woes may well be offset by "expected" Q4 GDP of +0.7% in Spain, where 'tis said that not only is internal demand "resilient", but that job creation is "intense". La siesta ha terminado, eh?
- And the EuroZone's premiere economy, that of Germany, is "expected" to see its Q4 GDP growth significantly accelerate toward the 2% level; the weakening euro appears to be an economic positive over there ... and yet so has a strengthening dollar accompanied our rising Econ Baro over here ... hmmm...
- Forbes featured a piece this past week on "Why It's The Perfect Time To Buy Stocks"; a fairly scary assessment, that, (given our "live" price/earnings ratio of the S&P is presently 34.0x). As suggested last week, the incoming U.S. President shall suffer a strained stock market, earnings ought needing to double just to maintain current price levels, else "Ciao S&P Bello!"
- As for the end of an era, we mistily say "Ta-Ta" to Zsa Zsa , the nine-times marrying Gabor having departed this veil of tears after ninety-nine years. Her passing really does punctuate the end of the golden age of cinema, back when film and its talent stood marvelously on its own accord without the aid of computer graphics. You filmed either in the back lot, or better still, on location, and actually had to act!