Get 40% Off
💰 Buffett reveals a $6.7B stake in Chubb. Copy the full portfolio for FREE with InvestingPro’s Stock Ideas toolCopy Portfolio

Gold: Textbook Bearish Flag Formed, Look For Price To Go Lower

Published 08/06/2015, 04:45 AM
Updated 05/14/2017, 06:45 AM
GC
-

Gold has once again found itself in a consolidation pattern and this time it looks rather like the textbook version of a bearish flag pattern. This is likely to lead to a sharp breakout lower that will take gold close to the psychological level at the $1,000 an ounce handle.
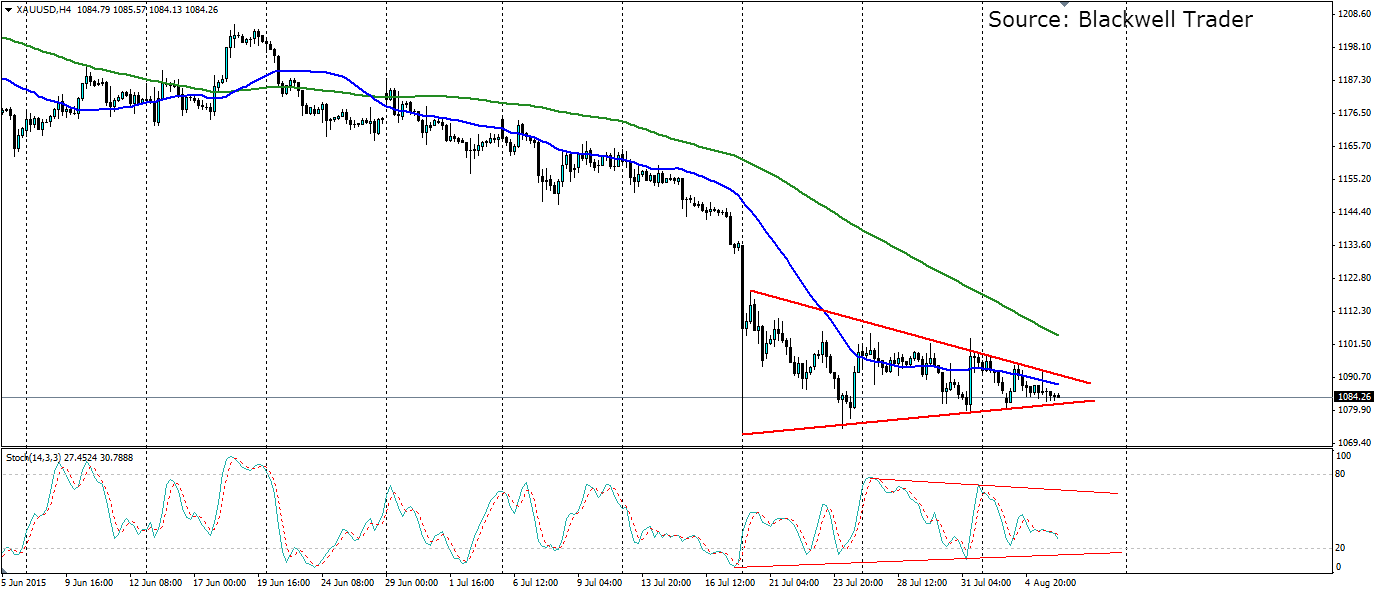
XAU/USD 4-H Chart , June-August 2015

After gold’s ‘flash crash’ two weeks ago, where someone dumped $2 billion dollars worth of the precious metal, it has consolidated not far above the lows it found. This sharp drop forms the ‘flagpole’ of the consolidating bearish flag pattern. From there we saw a roughly 50% retracement back up to $1,119.09 which forms the top of the shape. The price has consolidated and is now getting close to the sharp end of the shape so we can expect a breakout in the near term.

The Stochastic Oscillator also confirms the consolidation pattern. It has formed higher lows and lower highs as each wave gets tighter. Look for a break below the recent low on the Stoch to confirm a breakout. This will likely occur simultaneously as a price breakout.

The fundamentals also point to a weaker gold price. The Federal Reserve is widely expected to raise interest rates when they meet in September. This will certainly be bearish for gold because fixed interest assets will yield relatively more. Also keep an eye on the US Nonfarm Payroll figures due later on this week. If the result is stronger than expected, we could see it force the breakout of the flag pattern.
3rd party Ad. Not an offer or recommendation by Investing.com. See disclosure here or remove ads .

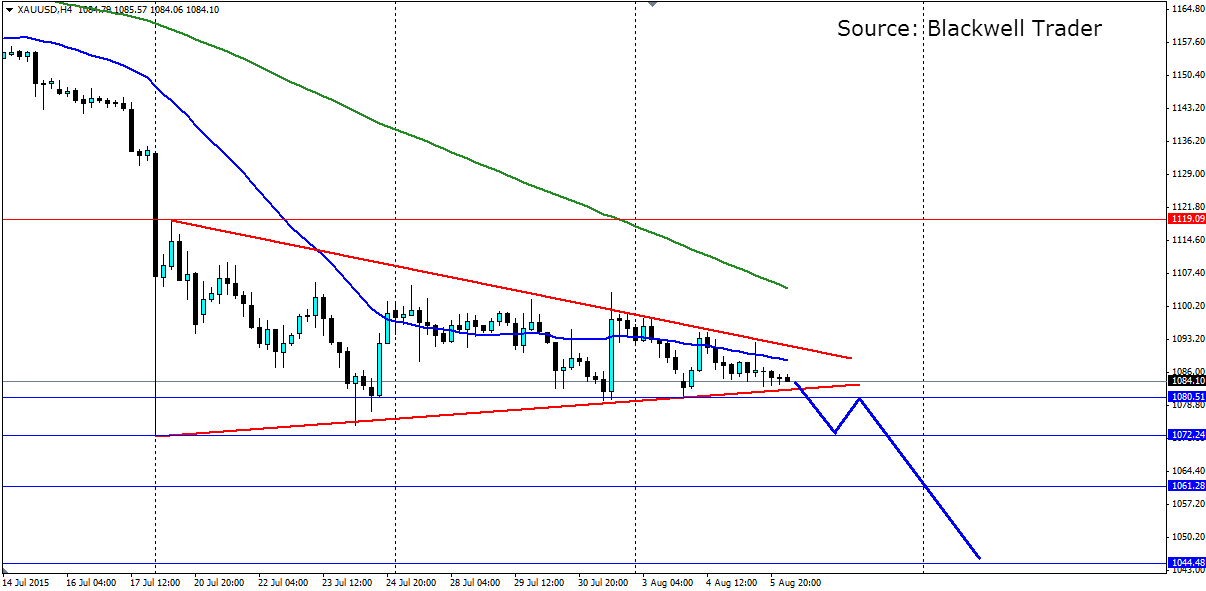
XAU/USD 4-H Chart

Traders looking to take advantage of the set-up can wait for the break of the minor support at 1080.51, which is outside the shape and will confirm a breakout if it holds as resistance. The length of the flagpole is generally used to determine the target for the breakout. In this case the flagpole is roughly $70 an ounce in length so we will be looking for a $70 breakout of the pattern. Further support levels that will be targeted are found at the recent low of 1072.24, and previous support levels at 1061.28, 1044.48 and 1026.74.

Latest comments

Dear i like the above study as i am almost having same studies on my charts for gold. But i would like to correct you at some points. As above mention charts are 4hr time frame. Better you try to draw same triangle on day chart & then adjust the same tradeline points on 4 hr.. . Meanwhile gold printed more than 2 bullish candles on last 10 days & that too very close to the 161.8% fib ret. level......don't you think it could provide a corrective bounce towards $1124 - 1132 - 1143 once before falling more. ???. . In general , triangle pattern can provide any side breakout . Can not be considered as bearish pattern only like rising wedge.. . Think about it & do share further views.. . Regards
aha gold $1124....told you
Risk Disclosure: Trading in financial instruments and/or cryptocurrencies involves high risks including the risk of losing some, or all, of your investment amount, and may not be suitable for all investors. Prices of cryptocurrencies are extremely volatile and may be affected by external factors such as financial, regulatory or political events. Trading on margin increases the financial risks.
Before deciding to trade in financial instrument or cryptocurrencies you should be fully informed of the risks and costs associated with trading the financial markets, carefully consider your investment objectives, level of experience, and risk appetite, and seek professional advice where needed.
Fusion Media would like to remind you that the data contained in this website is not necessarily real-time nor accurate. The data and prices on the website are not necessarily provided by any market or exchange, but may be provided by market makers, and so prices may not be accurate and may differ from the actual price at any given market, meaning prices are indicative and not appropriate for trading purposes. Fusion Media and any provider of the data contained in this website will not accept liability for any loss or damage as a result of your trading, or your reliance on the information contained within this website.
It is prohibited to use, store, reproduce, display, modify, transmit or distribute the data contained in this website without the explicit prior written permission of Fusion Media and/or the data provider. All intellectual property rights are reserved by the providers and/or the exchange providing the data contained in this website.
Fusion Media may be compensated by the advertisers that appear on the website, based on your interaction with the advertisements or advertisers.
© 2007-2024 - Fusion Media Limited. All Rights Reserved.