Get 40% Off
👀 👁 🧿 All eyes on Biogen, up +4,56% after posting earnings. Our AI picked it in March 2024.
Which stocks will surge next?
Unlock AI-picked Stocks

Gold Forming Wedge

Published 09/11/2014, 03:19 AM
Updated 07/09/2023, 06:31 AM

There is a falling wedge forming on the short term Gold charts as the price consolidates. This could lead to a bullish break out that will target the top of the bearish channel.
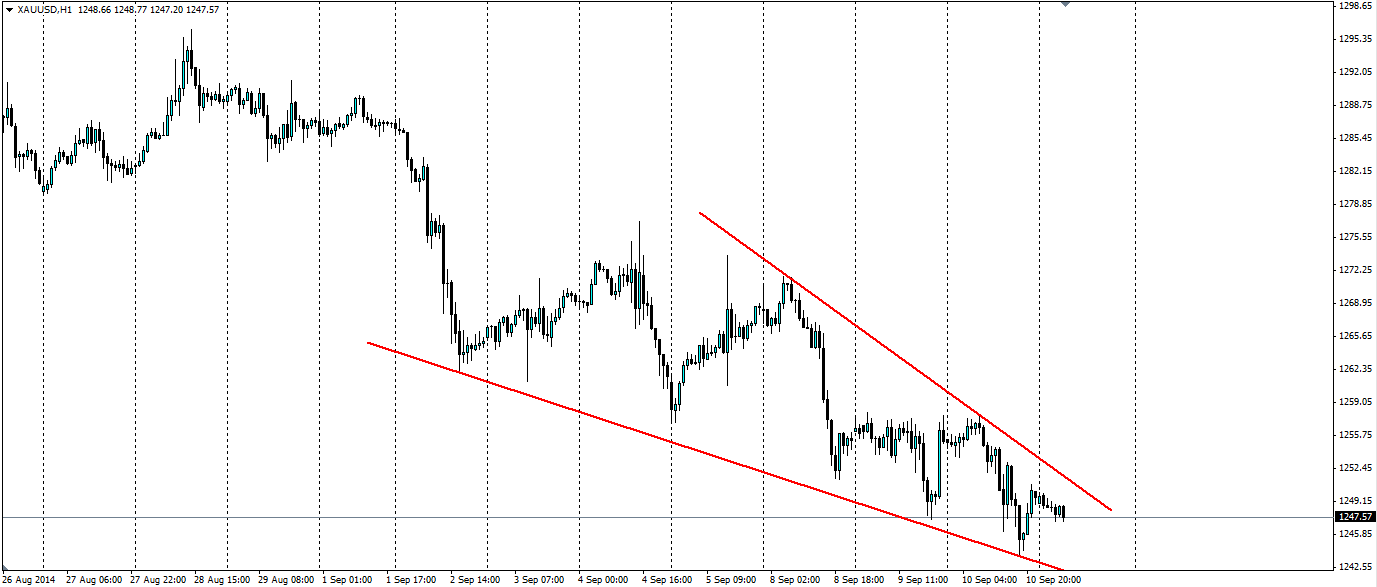
XAU/USD 1 Hour

Gold futures have been on a bearish run lately as the US economy looks more robust and the US Federal Reserve contemplates the timing of interest rate rises. The US dollar has been rising on the weakness in the euro and the pound and this is also having an effect on gold. The result is a falling wedge that is actually a bullish pattern, however an upside breakout is required first.

As the price is squeezed, with any luck we will see a bullish breakout. There may be a small pull back on the first breakout which tests the trend line. If this holds as dynamic support then we could see a much larger movement towards the top of the bearish channel as noted in the H4 chart below.
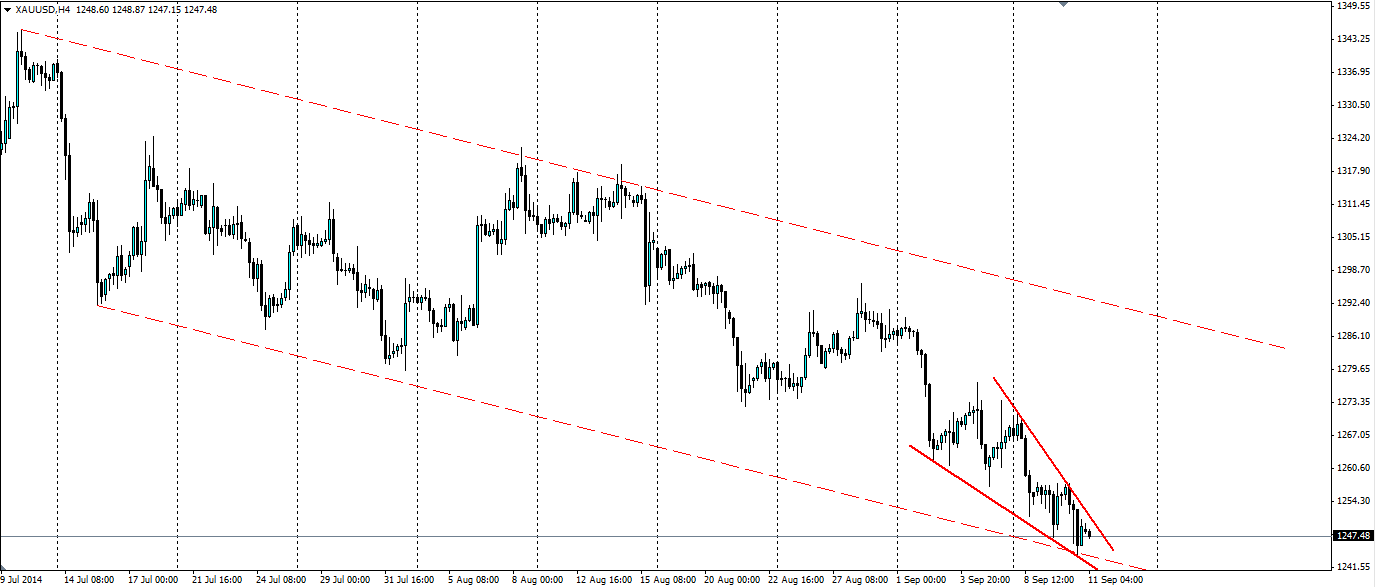
XAU/USD H4

It would pay to keep an eye on the US Unemployment claims as labour statistics have a big impact on the gold markets. US retail sales on Friday will also be watched by Gold traders as they give an indication of the state of the US economy.

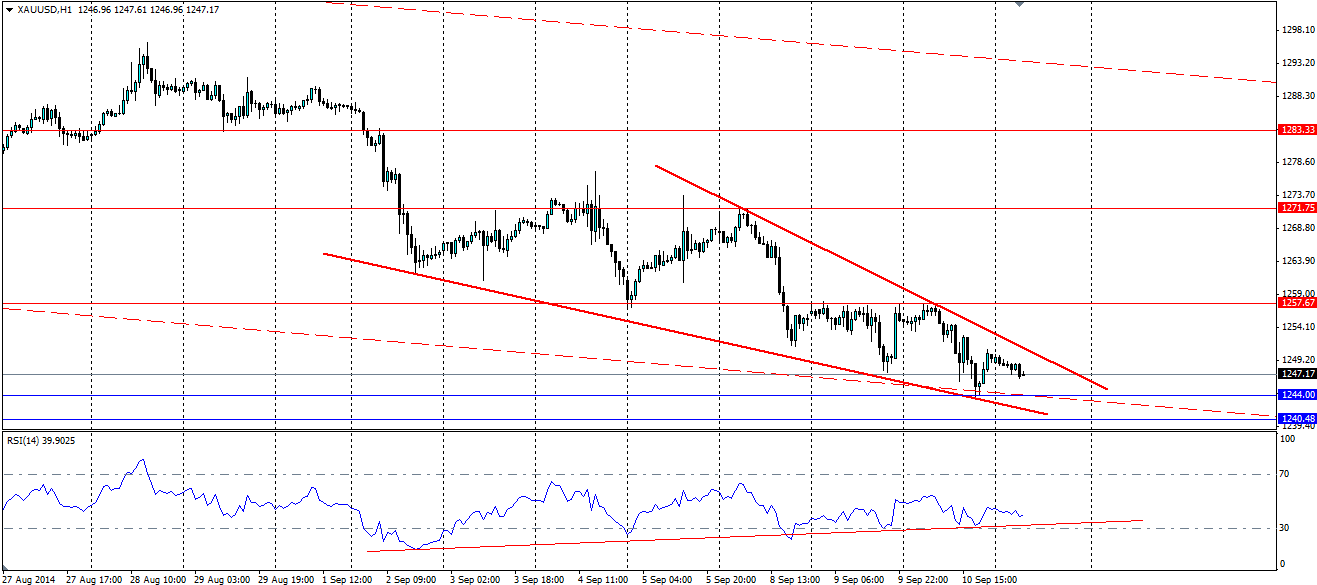
The RSI appears to be shifting towards the bullish side. It has come back from very oversold, with each progressive low higher than the last. If we do see a bullish breakout, look for resistance at 1257.67, 1271.75 and 1283.33 to potentially hold up the price movement or act as exit points, and of course look for the upper level of the channel to act as dynamic resistance. Support levels can be found at 1244.00 and 1240.48, with both the wedge and the channel acting as dynamic support.
3rd party Ad. Not an offer or recommendation by Investing.com. See disclosure here or remove ads .

XAU/USD H1 with RSI

Gold futures are forming a falling wedge on the hourly chart which may lead to a bullish breakout and reversal of the recent downward trend. It could then find resistance at the top of a bearish channel.

Latest comments

Risk Disclosure: Trading in financial instruments and/or cryptocurrencies involves high risks including the risk of losing some, or all, of your investment amount, and may not be suitable for all investors. Prices of cryptocurrencies are extremely volatile and may be affected by external factors such as financial, regulatory or political events. Trading on margin increases the financial risks.
Before deciding to trade in financial instrument or cryptocurrencies you should be fully informed of the risks and costs associated with trading the financial markets, carefully consider your investment objectives, level of experience, and risk appetite, and seek professional advice where needed.
Fusion Media would like to remind you that the data contained in this website is not necessarily real-time nor accurate. The data and prices on the website are not necessarily provided by any market or exchange, but may be provided by market makers, and so prices may not be accurate and may differ from the actual price at any given market, meaning prices are indicative and not appropriate for trading purposes. Fusion Media and any provider of the data contained in this website will not accept liability for any loss or damage as a result of your trading, or your reliance on the information contained within this website.
It is prohibited to use, store, reproduce, display, modify, transmit or distribute the data contained in this website without the explicit prior written permission of Fusion Media and/or the data provider. All intellectual property rights are reserved by the providers and/or the exchange providing the data contained in this website.
Fusion Media may be compensated by the advertisers that appear on the website, based on your interaction with the advertisements or advertisers.
© 2007-2024 - Fusion Media Limited. All Rights Reserved.