Gold for Monday, May 12, 2014
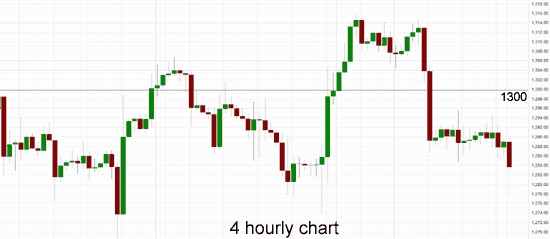
Over the last week, Gold has eased back from around $1315 which included a short sharp fall back down below $1300, down to support around $1290. It has now steadied and consolidated around the $1290 level for the last couple of days or so before finishing out last week and starting this week moving slightly lower. Prior to the fall it had done well to surge higher to around $1315 a couple of weeks ago which saw it move well off support around $1280. If gold was to retreat again back towards $1275, then a large descending triangle would be forming which would indicate lower prices below $1275. Over the last couple of months the $1275 level has established itself as a level of support and on several occasions has propped up the price of gold after reasonable falls.
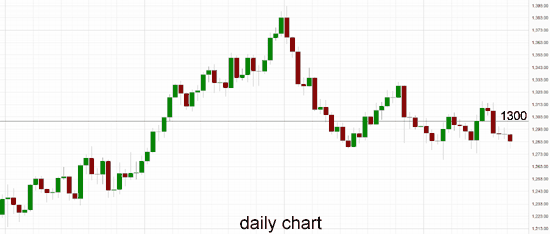
Throughout the second half of March gold fell heavily from resistance around $1400, back down to a several week low near support at $1275. Both these levels remain relevant as $1275 continues to offer support and the $1400 level is likely to play a role again should gold move up higher. Through the first couple of months of this year, gold moved very well from a longer term support level, around $1200, up towards a six month higher area near $1400, before returning to its present trading levels, closer to $1300.
Gold settled slightly lower last Friday, logging its second straight weekly loss as the dollar took support from euro weakness and traders awaited further news on Ukraine. The dollar extended gains against the single currency after posting its biggest one-day rise since mid-March on Thursday, as investors positioned for more monetary stimulus from the European Central Bank. Gold is still searching for direction as concerns over the stand-off between Russia and the West over Ukraine abated, and Federal Reserve Chair Janet Yellen held pat on U.S. monetary policy. U.S. gold futures for June delivery ended 10 cents lower at $1,287.60 an ounce, down 1 percent on the week. Meanwhile, spot gold dropped 0.1 percent to $1,288 an ounce.
Gold May 12 at 01:00 GMT 1283.6 H: 1290.1 L: 1277.6
Gold Technical
| S3 | S2 | S1 | R1 | R2 | R3 |
| 1280 | 1275 | --- | 1315 | 1330 | --- |
During the early hours of the Asian trading session on Monday, Gold is easing back again and looking towards support at $1280. Current range: trading just above $1280 around $1284.
Further levels in both directions:
• Below: 1280 and 1275.
• Above: 1315 and 1330.
OANDA's Open Position Ratios
![]()
(Shows the ratio of long vs. short positions held for Gold among all OANDA clients. The left percentage (blue) shows long positions; the right percentage (orange) shows short positions.)
The long position ratio for Gold has moved back up to 70% as gold remains lower under the $1300 level. The trader sentiment remains in favour of long positions.
Economic Releases
- 23:50 (Sun) JP Bank Lending Data (Apr)
- 23:50 (Sun) JP Current Account (Mar)
- 01:30 AU NAB Business Conditions (Apr)
- 01:30 AU NAB Business Confidence (Apr)
- 18:00 US Budget (Apr)
- EU EU Foreign Ministers hold meeting in Brussels


