Following the Friday 13 November atrocities in the Île-de-France, the Precious Metals secured little "safe-haven" response. But for their wee reactive bounce, 'twas bizarre having both Silver and Gold commence last week with three consecutive down days, made all the more disconsolate by the yellow metal busting below through what had been its low for the year (at 1072), in being offered this past Wednesday as low as 1062.
But be it the ever more sobering scrutineering of the spreading state of terrorism, or the reaction to a ridiculously undervalued market, or simply the Shorts getting shaky, Thursday brought a burst from the buyers, such as to swiftly drive Gold up, similar to those "rocket shots" we'd been portraying during Gold's summer rally. Like then, we again sensed an urgency to get on board, for within the bidding came a move from 1069.7 up to 1086.6, (+16.9 points) in just a three-hour stint on a day which exceeded our entire 23-hour "expected daily trading range" of 14.8 points. 'Twas yet again another observation over these many years that Gold, unlike other markets, has a hankerin' to rise faster than fall. But then sadly closing out these past five days with yesterday's (Friday's) appalling massacre in Mali, Gold failed to keep its grip, going on to record a fifth consecutive down week and thus furthering its Short weekly parabolic trend as we see here:
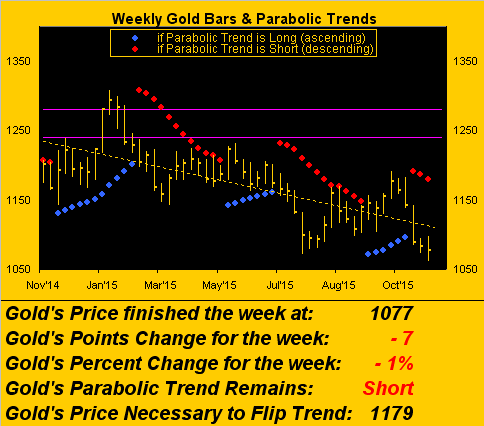
Bizarre as well -- and we'd touched on this back in July -- is upon Gold's having since arrived at the year's new low of 1062, that price is just 189 points away (per 1980's "spike" high of 873) from wiping out some 35 years of mitigating currency debasement! 'Tis Nuts! And for those of you scoring at home, Gold's first encountering the 1062 level (post Black Swan in 2009) was when the StateSide M2 money supply was $8.47 trillion. At this writing 'tis 46% higher at $12.35 trillion. That alone ought have Gold right now at 1580 -- and for you Gold Scoreboard followers -- even accounting for increases in the Gold supply itself, the overall M2 debasing these past 35 years puts our present Gold valuation at 2566. And yet we're bollocking about down here at 1077? Really? (Further consider this: if such valuation is presently "undershot" by 1489 points, add such deviation to being "overshot" and that'd put Gold at 4055. Preposterous? Not really ... 'tis the way markets work).
'Course with each day's passing, Gold's excuse for faltering is given the increasing "odds" for the Federal Reserve Bank's raising of its Funds rate on 16 December. Naturally, this is all being based upon the Federal Open Market Committee's 28 October policy statement, the minutes thereto having been released on 18 November, and the sprinklings throughout of FedSpeak. We're even seeing the "Ump-dee-ump things to know ahead of the Fed hike" as if 'tis already a done deal, beyond doubt baked into the cake. Truth be shown, here's the deflating soufflé from our oven:
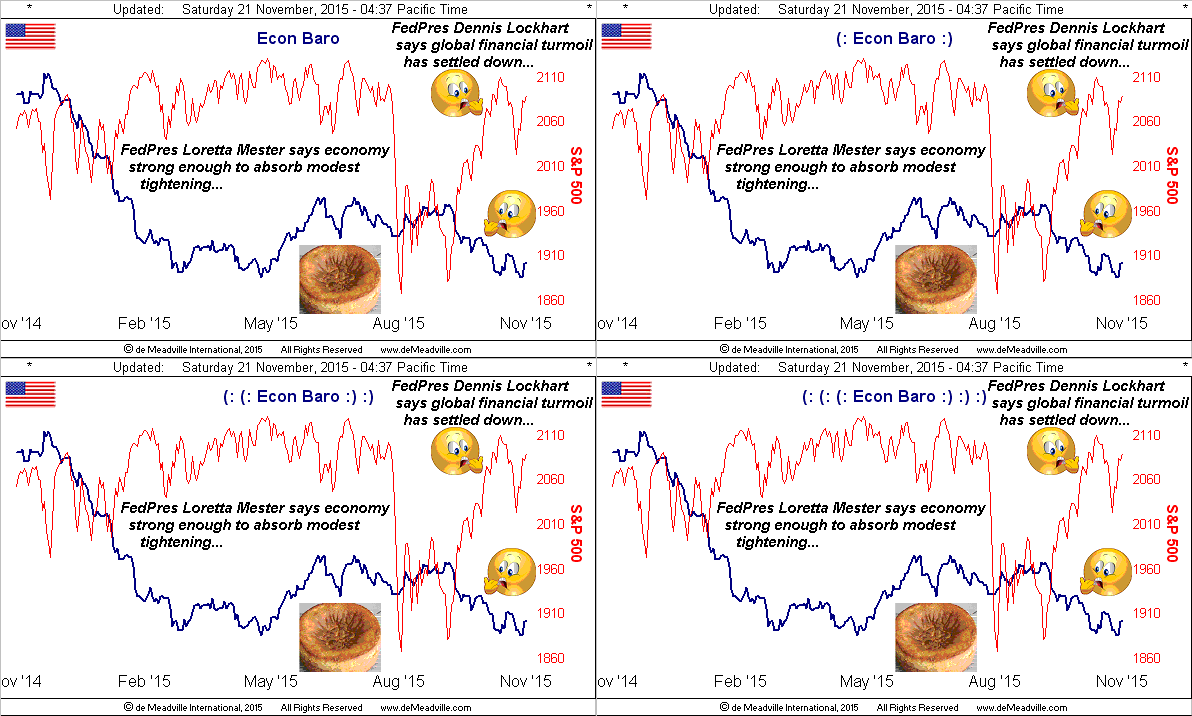
To quote Paul McCartney, ![]() "Get back Loretta"
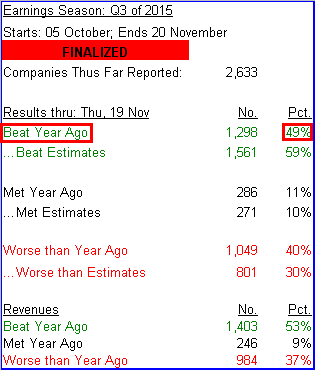
"Get back Loretta"![]() ('69). As for global financial markets, given our "live" price/earnings ratio of 46.5x for the S&P 500, we've yet to see turmoil. In fact, how high can it all fly as a mediocre Q3 Earnings Season has come to a close -- and with 2,633 results counted as we below show -- only 49% bettered Q3 of a year ago. Very scary stuff, that...
('69). As for global financial markets, given our "live" price/earnings ratio of 46.5x for the S&P 500, we've yet to see turmoil. In fact, how high can it all fly as a mediocre Q3 Earnings Season has come to a close -- and with 2,633 results counted as we below show -- only 49% bettered Q3 of a year ago. Very scary stuff, that...
Such crazy times these are! Stocks are rising sans earnings support, along with perceptions of "dollar strength" and a belief that the Fed shall nick up their rate of interest charged to borrowing banks, surely in turn to be passed on to all you variable rate debt holders out there. "Fergit that dinner at Slim's tonight, Mabel, 'cause this upped credit card minimum payment just busted our budget." Then there'll go the dominoes...
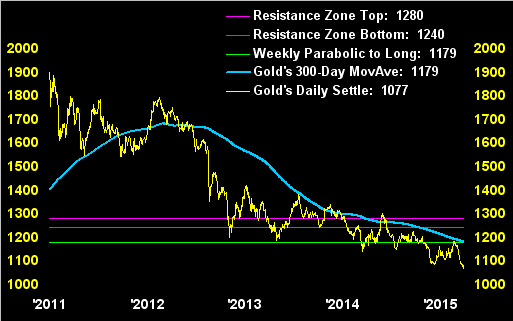
Not getting better is Gold, for as we turn to our criteria of "how we'll know when the bottom is in", price today at 1077 needs to flip the weekly parabolic trend back to Long at 1179, presently the same the level of the 300-day moving average, above which we need trade and in time turn that average upward, as well as clear a fully week's trading above the 1240-1280 resistance zone. Here are those levels vis-à-vis Gold's daily closes from the highest ever of 1900 on 22 August 2011:
But from our "You Gotta Start Somewhere Dept.", a glimmer of technical hope popped up on the screen yesterday. At the end of each day's trading, the following BEGOS Markets table appears. Here's how it looked yesterday:
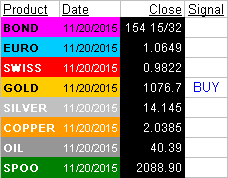
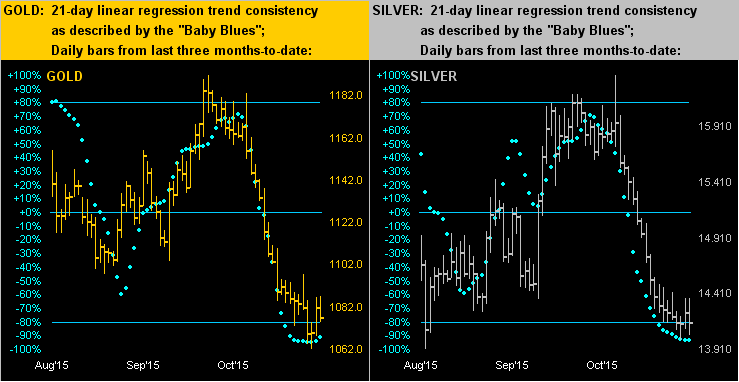
So why does the table signal "Buy" given the gloom of the graphic prior? Such signals are triggered by the "Baby Blues" curling either down -- or in this case up -- near a trend's end. Thus here next for both Gold on the left and Silver on the right are the last three months of daily bars along with their baby blue dots that depict 21-day linear regression trend consistency. Behold the up curl for Gold:
Moreover, at Thursday's settle (1081), Gold's daily parabolics confirmed a flip to Long for Friday's opening trade (1080) as we next see in this chart of each day's bars from last December-to-date. When the bars are red, the daily parabolic trend is Short, else Long if green, as is yesterday's bar:
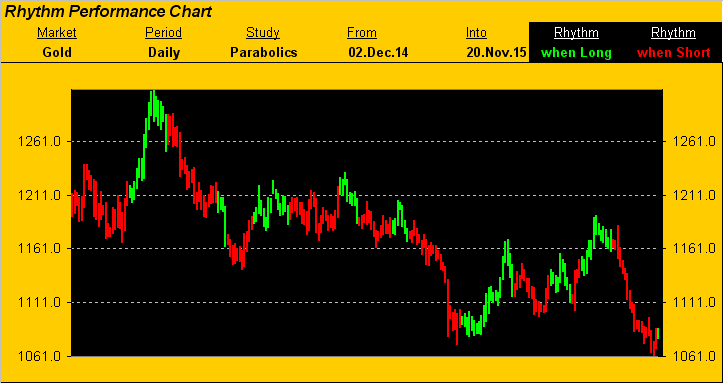
Indeed, per the current listing at the website's Market Rhythms page, the above study ought see a $1,600/contract run (+16 points), from yesterday's 1080 open, up to at least 1096; (be wary that 30 November is "first notice" for December Gold, which is "deliverable" should "they" be able to find any for you; thus simply for a trade, you might look to the February contact).
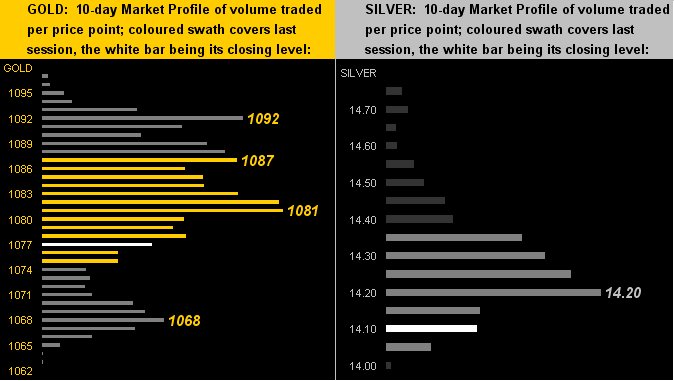
We'll wrap here for this week with the 10-day Market Profiles for both Gold (left) and Silver (right), followed by a few final notes. Per this missive's title of buyers stemming Gold's outflow, you can see price (the white bar) having rebounded off the bottom of its Profile. The next trick in order to achieve the aforementioned run to 1096 will be breaking up through the Profile's denoted resistors. As for Sister Silver, her Profile is paltry, (as remains her 12-hour Moneyflow study that we'd herein highlighted a week ago). Blame it on Cousin Copper this past week having made yet another six-year low (2.0305), Sister Silver thus being sympathetically adorned in her industrial metal jacket, (as opposed to her precious metal pinstripes):
In parting, blind as the FOMC members appear to be with respect to our declining StateSide Economic Barometer, 'round the globe ![]() "The song remains the same"
"The song remains the same"![]() --(Led Zeppelin, '73). To wit:
--(Led Zeppelin, '73). To wit:
■ The Japanese economy yet again has slid into recession, as after the gross domestic product's annualized -0.7% slide in Q2, 'tis this time slid by -0.8% for Q3. Looks like Prime Minister Shinzō "Honest" Abe has some 'splainin' to do...
■ European Central Bank President Mario "Here I Go" Draghi has put his ECB race car on pole position for a fast start at their 03 December meeting toward boosting the EuroZone's anemic inflation. We look forward to his peeling out to stimulate, versus our Fed's "talk" to strangulate...
Oh, and one more thought for your valued consideration. You've likely read recently that, per the World Gold Council, the demand for Gold bars and coins surged 207% in the United States during Q3, the WGC going on to note such a level of interest as not having been seen since the global financial crisis. Gold's Black Swan low back then was 681, from which it made the +182% run to 1923. Apply same to today's lowly 1077, et voilà, 'twould bring a new All-Time High at 1960. Just sayin'...
This coming Wednesday (25 November) is oft dubbed "the busiest travel day of the year" as folks flee off to their families. 'Tis also traditionally one of the busiest incoming Econ Data days of the year as we'll have seven metrics of stuffing put into the Econ Baro at the website. Something at which to gaze on your mobile device whilst standing in lines and sitting on tarmacs. Later, you might even share the Baro with Grandma. "I've put extra giblets in the gravy for you!"