Whence we left you a week ago, Professor Marché has now posted the test results for gold and silver, (and with a dismissive "harrumph", has left the ivy-covered brick building for the Bohemian Club).
The two Precious Metals neither aced nor failed their examination. Professor Marché in almost scrawling a "D+" on their respective "blue books" instead in a last-second change of heart scored them both with a "C-", knowing in spite of the week's lackluster efforts that gold and silver having shining futures ahead of them. Don't want to overly discourage the lad and lassie. They're just stuck at the moment.
And as you'll recall from our last missive, 'twas a tough test for both. Gold had to not just stay north of 1280, but further break up and away from The Whiny 1290s. Instead, the yellow metal settled out the week yesterday (Friday) at 1290, trading en route as low as 1271. Silver had to stay aloft after rising 20% in just 19 trading days, a feat that had not been sustained the prior three times it had occurred since 2011. Instead, the white metal settled out the week at 17.51, trading en route as low as 17.22. A rather mediocre, but not necessarily unexpected, performance by the pair. Indeed per each one's trading range for the week, 'twas gold's fourth narrowest of the 14 trading weeks year-to-date; and for silver 'twas its third narrowest in the last two months.
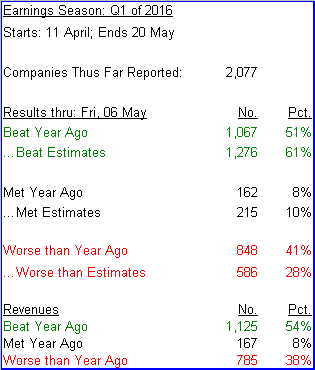
'Course, the real flunkies for the week, moreover for many-a-week, were (and continue to be) Q1 Earnings Season and the Economic Barometer. By our tally of the 2,077 companies having thus far reported, we've but 51% having bettered their earnings over same quarter of a year ago. 'Course our friendly FinMedia colleagues rarely cite such hard truth. To wit, this bit which emanated from Bloomy through the bedside radio in the wee hours of last Monday, (paraphrased): "Of S&P 500 companies reporting so far, 78% have beaten estimates (not what I wanna hear), but only 57 % have improved revenues" (also not what I wanna hear). What do I wanna hear? How many companies actually improved their bottom lines. What is so difficult about reporting that? Ratings, as folks tend to tune out on lousy financial news. Here's our overall Q1 Earnings Season tally to this point:
And as noted, the other failure for the week was the Econ Baro, its downhill run continuing to elude members of the Federal Open Market Committee. Our own John Williams at the Federal Reserve Bank here in San Francisco said mid-week that 'twould be "reasonable" for the Fed to make two or three rate hikes this year, depending on incoming economic data. The non-voting FOMC member went on to note that "I'm not taking too much of a signal from the first-quarter GDP", (the initial reading for which you'll recall was 0.5%, practically thirded from the Q4 final reading of 1.4%). I guess he means it really doesn't count. But the 23% slide in April's net payroll creation to 160,000 from March's 208,000 ain't helping ... albeit that slowing may soon be mitigated, for as you may have read, stalwart Wal-Mart (NYSE:WMT) is bringing door greeters back to most of its some 5,000 stores, (although this may simply be through re-assigning existing employees from the stock floor to the front door). Either way, here's the Baro with a musical serenade to the S&P:
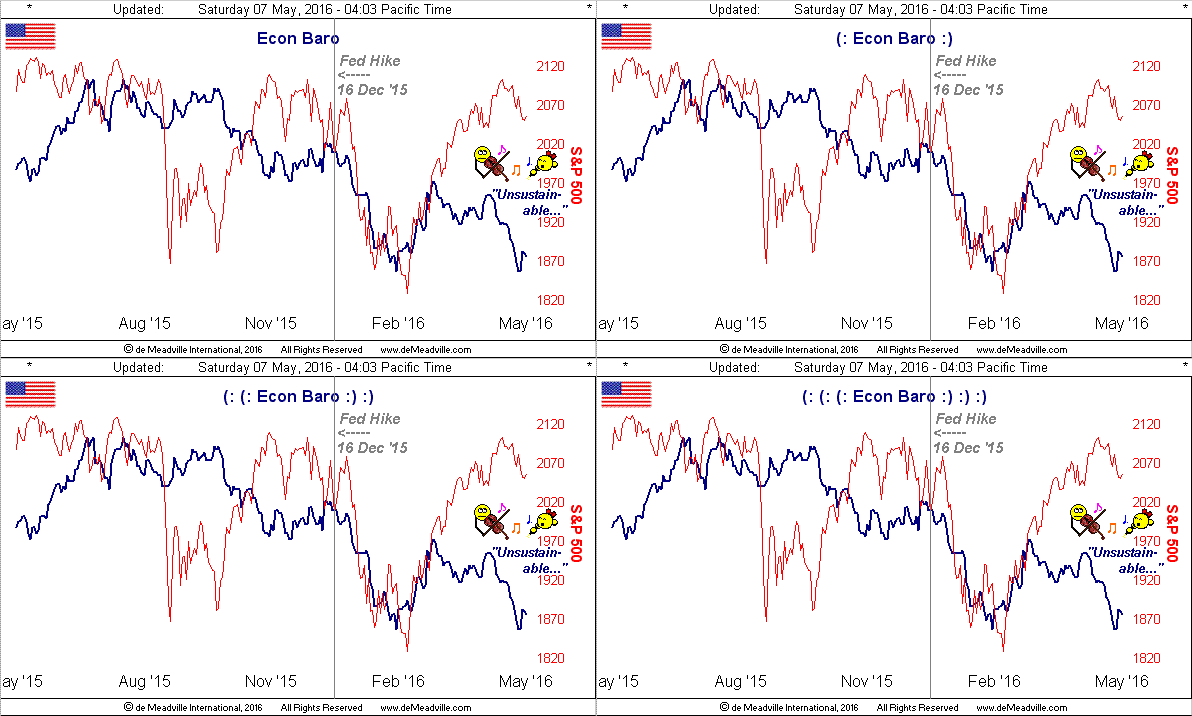
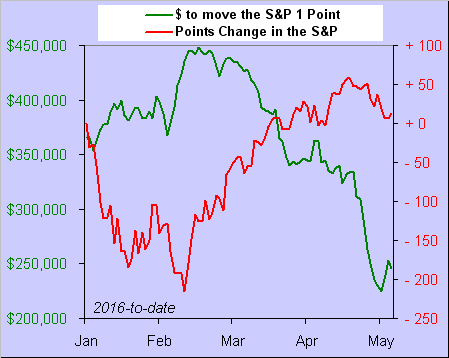
Further, you may have read of a quant analyst over at BofA/Merrill noting that their institutional investors have set a record 14th consecutive week in unloading equity positions (that's essentially every week so far this year), a run unprecedented in the investment bank's recording of such data. That said, you can above see in the red track of the S&P, that equities index hasn't materially come off at all. But by our kind of quanting, 'tis getting very "thin" out there. The below graphic depicts the year-to-date change in the S&P (red) vs. our calculation of the amount of money (green) it takes to move the S&P one point. The lower the green line, the easier 'tis to boff the S&P about one way or the other; and right now, it takes only half the dough it did back in February:
"That is scary, mmb"
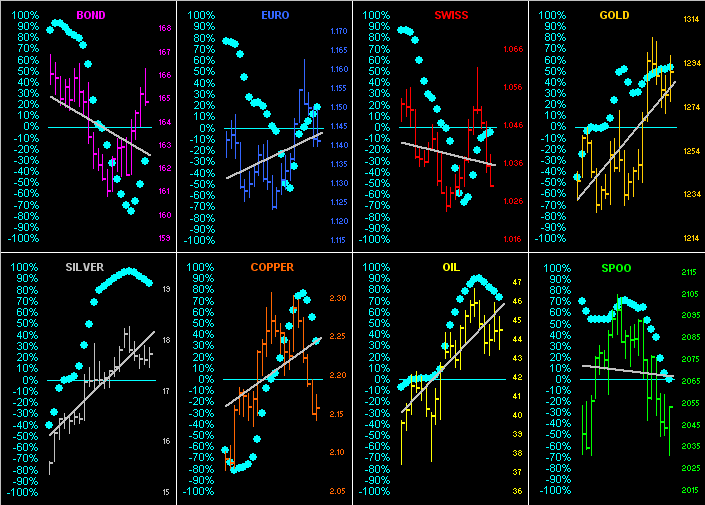
Ya think, Squire? 'Twould portend things getting worse in a hurry. In fact, let's bring up the "Baby Blues" not just only for the Precious Metals, but for the full eight components that make up our BEGOS Markets complex. ('Tis not so much about the prices in this next graphic as 'tis about the visual trends). Below are the last 21 trading days (one month) for each market along with their diagonal linear regression trendlines and the blue dots which depict the day-to-day consistency of those trends. Look at the lower-right panel for the "SPOO" which is the futures contract for the S&P: the blue dots are just about to go sub-zero, in turn suggesting still lower levels ahead:
As for gold itself, in the context of having performed so well of late, you can see over the course of the past week's "test" that price produced but a stubby little bar as we turn to those from one year ago-to-date. The current parabolic Long trend of 15 weeks duration is the longest we've had since a 20-week up run that ended in June 2009 on the fleeting tail of the Black Swan:
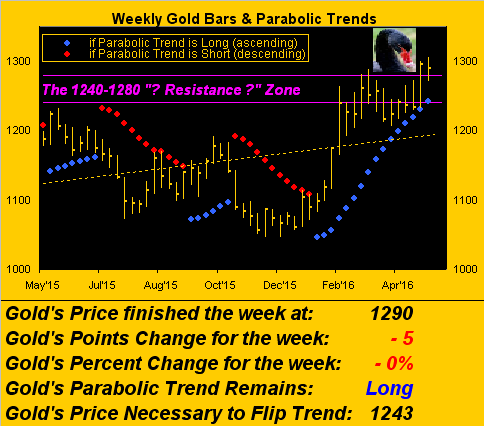
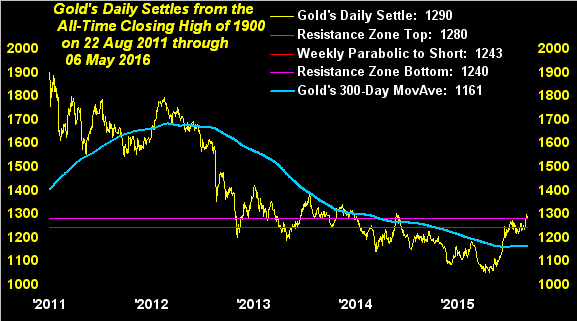
Now because gold was not able to stay above 1280 for the entire week, the criteria for "how we'll know when the bottom is in" (as measured from last 03 December's low of 1045) have yet to be entirely satisfied. Here they are, followed by their graphic, (and therein, the red parabolic level is so close to the lower purple line, they appear as a single red line):
■ The weekly parabolic trend ought be Long ('tis)
■ Price ought be above the 300-day moving average ('tis)
■ The 300-day moving average itself ought be rising ('tis)
■ Price ought trade at least one full week clear above 1280 (hasn't)
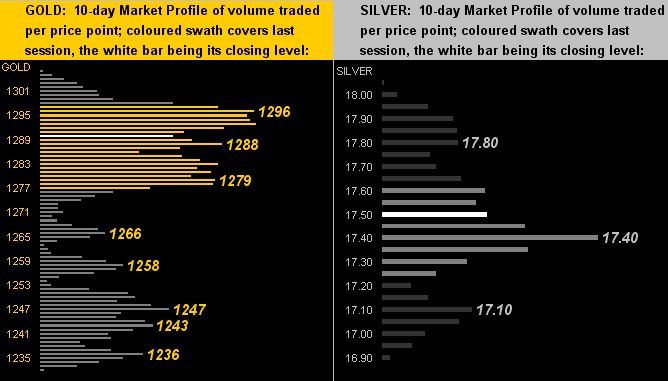
Our final graphic this time 'round is of the 10-day Market Profiles for both gold on the left and Sister silver on the right. Gold's apices (those prices with the largest amount of contract volume traded) are as numerous as we've ever seen, the good news there being 'twould be technically difficult for price to completely come unglued, (dare we again get stuck for months on end in The Whiny 1290s). Silver's profile is a bit more defined with the long 17.40 apex now appearing as a key support/resistance level:
Elsewhere...
■ Did anybody notice that Japan's Nikkei Index fell 3% in starting off this past week? Seems like whenever in recent years a move of that magnitude happens to the S&P, it tends to recover, (our current "live" price/earnings ratio of 37.7x be damned). Did anybody notice that the Nikkei did not recover? No.
■ Did anybody notice that the Reserve Bank of Australia "surprisingly" cut its cash interest rate target to a record low 1.75% this past Monday? It made the FinMedia rounds for a few hours, boosting the EuroCurrencies and bucking the buck. But come opening bell time in New York, unless you knew, you missed it.
■ Did anybody notice that the European Union this past Tuesday forecast that France, Italy and Spain all are on course are to miss their respective, requisite budget targets not for just this year, but for 2017 as well -- unless urgent government action (aka "accommodation") is taken? Why barely one week ago we read of growth surprises in the Q1 gross domestic products at least for both France and Spain. What happened? Further, a United Kingdom "PMI" survey now finds manufacturing to be contracting for the first time in three years. Got gold?
As for Europe's popularity contest, we doubt many missed this: 'tis "Mama don't take my €500 Euro Note away" versus "Let's all move to Switzerland so we can get free CHF2,500 per month". Really? Is arguably the world's greatest currency bordering on bitcoin? Let's hope not.
Yes, the whole world does seem to be quite upside down these days, whether it be in valuing that which is real (aka "gold") versus valuing that which is not (aka "paper"), not to mention priorities being terribly out of sorts. To wit: prior to last Wednesday's FOMC policy statement, (and yes prior to "leaving the building" as is our wont on Fed days), we visited a trusted "go to" financial site to assess the anticipative flavour of it all only to find their top "above the fold" headline to read: "2016 Craft Brewers Conference Begins In Philadelphia" Who can make this stuff up? So much for being on Fed-Watch.
Indeed as day-by-day it becomes ever more clear that the inmates really are running the ever-encompassing asylum from which the sane are desperate to escape, it becomes clearer still that gold is the real place to be. You'll see. Along with Sister silver, they'll be acing test after test in an upside spree!