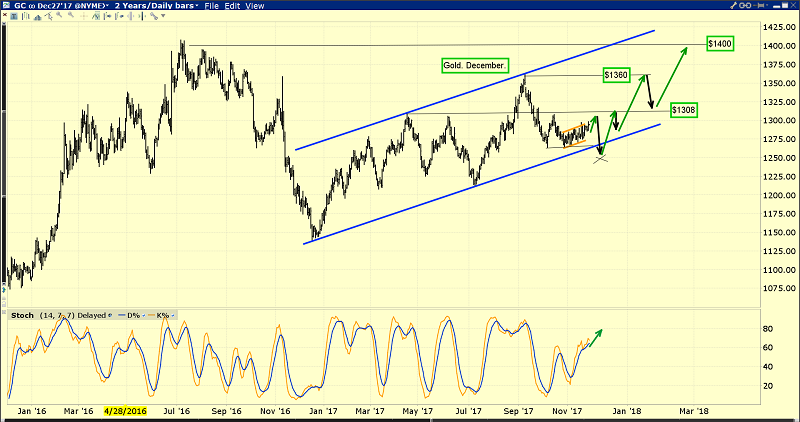
The big picture for gold continues to strengthen.
In 2016, gold began the year at about $1100, soared $300 an ounce to about $1400, but then it gave back about $250, and ended the year at about $1150 with only a $50 gain.
That price action fit perfectly with my 2014 – 2017 theme of “rough sideways action, initially with a downside bias that develops into an upside bias”.
The year 2018 should see solid Chindian demand, a reversal in US money velocity, and a peak in mine supply. That should push gold up from the enormous sideways trading pattern and into a substantial uptrend.
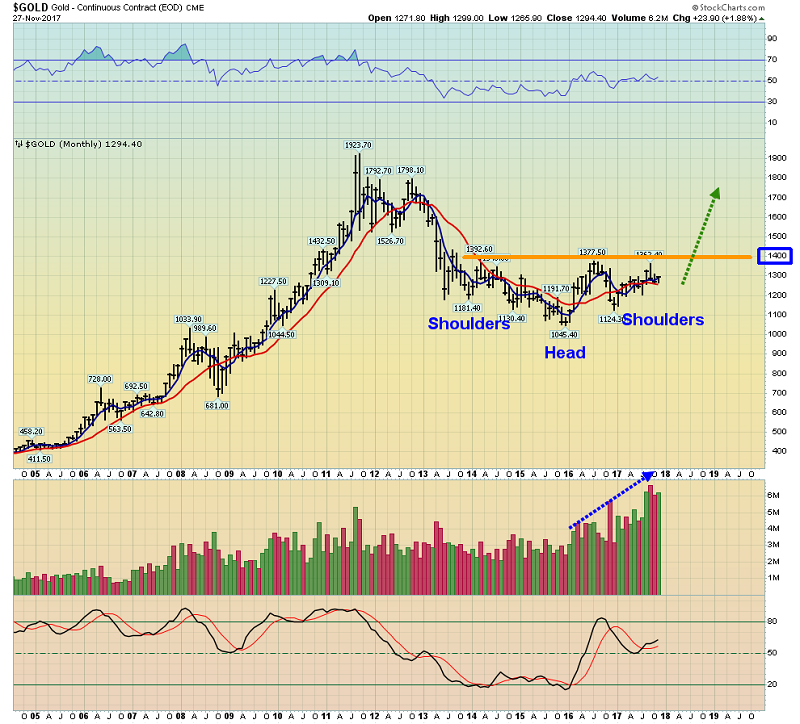
This is the key weekly gold chart.
Note the fabulous increase in volume since 2016. This is very positive.
One of my most important market mantras is that fundamentals make charts. I postulated the “gold will trade sideways with a slight downside bias” thesis in 2014 because I saw gold price discovery transitioning (slowly) away from the fear trade of the West and towards the love trade of the East.
The imposition of the vile 10% import duty in India put millions of jewellery workers on the unemployment line and it caused a huge restructuring of the jewellery industry.
The way it was playing out fundamentally suggested that an enormous inverse head & shoulders pattern would be created as that restructuring progressed.
The transition in America from deflation to inflation and the peak in mine supply are supporting fundamental factors for the way the inverse head and shoulders pattern has been built.
The bottom line is that in the right shouldering area of a massive inverse head and shoulders bottom pattern, investors should expect the price to trade sideways with an upside bias, and as the pattern nears completion, that upside bias will intensify.
That’s exactly what is happening now. Gold is poised to end 2017 giving back very little of what it gained.
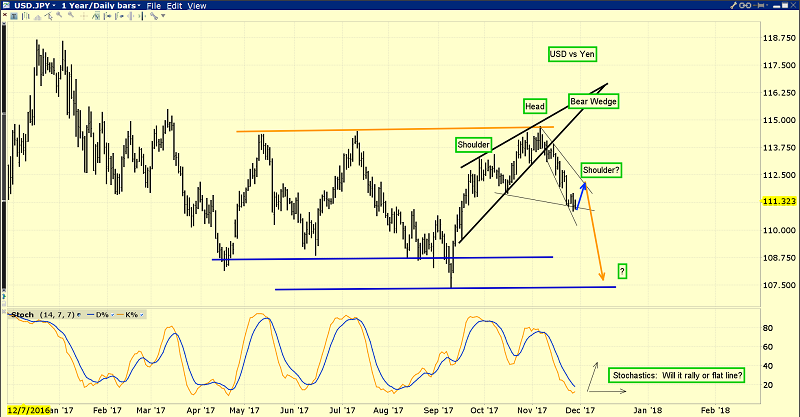
The dollar’s action against the yen is a key indicator of the amount of risk that institutional investors are likely to take.
On that note, the dollar has been very weak recently against the yen, breaking down from a bear wedge formation and forming a potential head & shoulders top. A potential weak right shoulder has yet to even materialize.
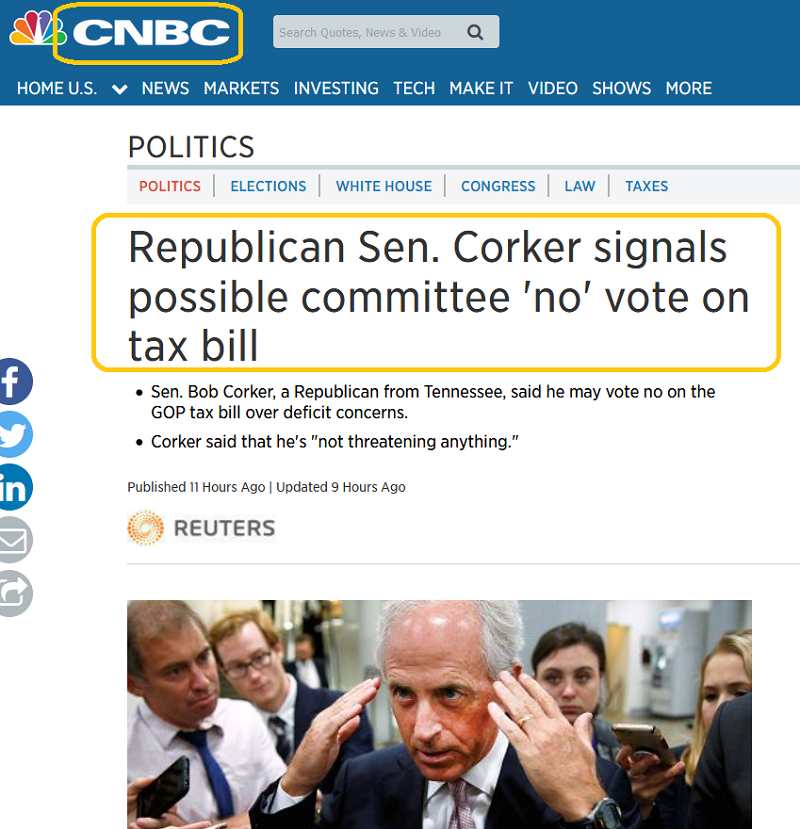
Why is the dollar so weak? The US stock market has no more QE and falling interest rates to power it higher in the face of rather anemic real economy growth.
Institutional investors are betting on tax cuts to keep the stock market party going, but it’s possible that major bank FOREX traders are selling the dollar in anticipation of a delay in getting the cuts done.
I’m very disappointed with Corker’s plan to raise revenues (taxes) if tax cuts don’t generate growth. A chainsaw needs to be taken to US government spending, but it’s not happening. The US stock market could take a major hit if the tax cuts legislation fails.
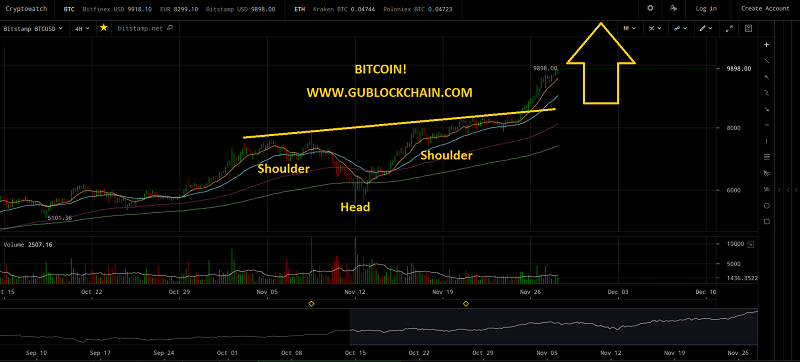
That could cause institutions to buy a lot more gold and assets like it. This is the spectacular bitcoin chart.
Effective immediately, I’m raising my long term bitcoin target from $500,000 to $2million. I’ll go over the fundamentals and mathematics of that target upgrade in my next gublockchain.com update, but I’ll note that the reasoning is quite mundane.
Still, I advised my subscribers to book some solid partial profits in the current $10,000 round number area early this morning. My accountant tells me that nobody gets poorer by booking a profit, and I agree!
Do I think bitcoin has inherently more risk or less risk than the US dollar? That’s hard to quantify, but great profits can be booked now, and that’s really all that matters.
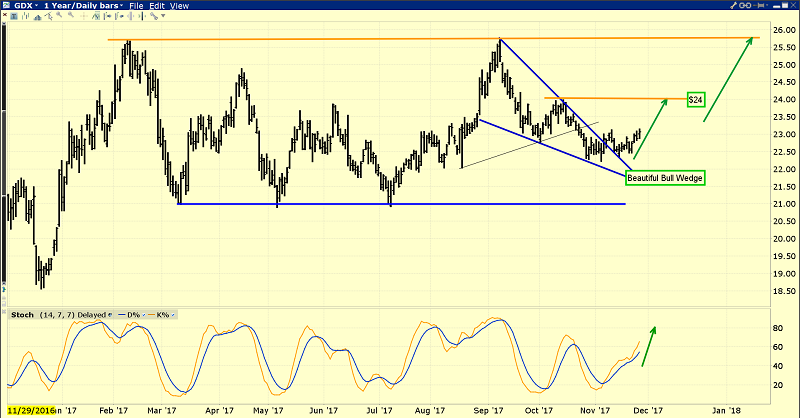
This is the nice VanEck Vectors Gold Miners (NYSE:GDX) chart.
There’s no question that some of the risky junior miners have had a very disappointing year, but most of the seniors are starting to look quite “perky”.
GDX sports a beautiful bull wedge pattern, and the next US jobs report is scheduled for Friday, December 8. That report should be the catalyst for a great gold stocks rally. It should also start gold on its final advance towards the key $1400 neckline area of the massive inverse H&S bottom pattern, with an upside breakout occurring in 2018!
Written between 4am-7am. 5-6 issues per week. Emailed at aprox 9am daily.
Stewart Thomson is a retired Merrill Lynch broker. Stewart writes the Graceland Updates daily between 4am-7am. They are sent out around 8am-9am. The newsletter is attractively priced and the format is a unique numbered point form. Giving clarity of each point and saving valuable reading time.
Risks, Disclaimers, Legal
Stewart Thomson is no longer an investment advisor. The information provided by Stewart and Graceland Updates is for general information purposes only. Before taking any action on any investment, it is imperative that you consult with multiple properly licensed, experienced and qualified investment advisors and get numerous opinions before taking any action. Your minimum risk on any investment in the world is: 100% loss of all your money. You may be taking or preparing to take leveraged positions in investments and not know it, exposing yourself to unlimited risks. This is highly concerning if you are an investor in any derivatives products. There is an approx $700 trillion OTC Derivatives Iceberg with a tiny portion written off officially. The bottom line:
Are You Prepared?
