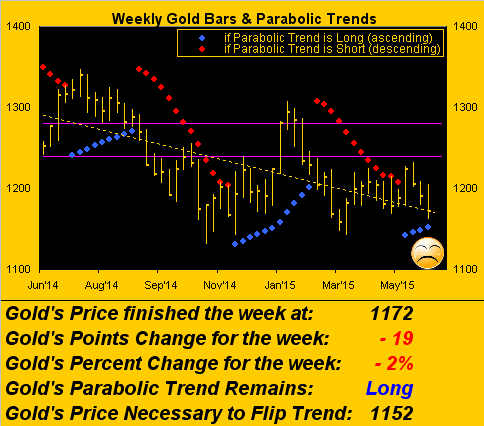
Our song and dance of a week ago concluded with a calculation for gold's realistically reaching the 1400s -- before this year is out -- based upon these two assumptions: 1) the low thus far holds (1142 on 17 March) and 2) the "expected yearly trading range" of 274 points runs its full course; thus the route to arrive north of 1400 remains arithmetically follows: 1142 + 274 = 1416. Such enthusiastic Golden gleam for our valued readers sent us into the last week with additional encouragement from gold's firm Market Profile support at 1189, bolstered further by the still Long parabolic weekly trend.
But rather than bucking up to our busking billing, the yellow metal instead found itself diving down in a double entendre as to the popular Rolling Stones hits' compilation entitled ![]() "Sucking in the Seventies"
"Sucking in the Seventies"![]() , the 1170s being wherein gold -- after first crossing back above 1200 for the "nth nillionth" time -- spent the balance of the week, (not to mention a brief, inglorious skid into the 1160s), settling yesterday (Friday) at 1172.
, the 1170s being wherein gold -- after first crossing back above 1200 for the "nth nillionth" time -- spent the balance of the week, (not to mention a brief, inglorious skid into the 1160s), settling yesterday (Friday) at 1172.
Ostensibly as one ought not fool with Mother Nature, so ought price not fool with the rising parabolic Long trend's blue dots as see we in our chart of gold's weekly bars. Still, with that 1152 level lurking as the price to flip the trend back to Short -- and 1142 as the year-to-date low by no means out of range toward fouling up our possible 1400s analysis -- three consecutive down weeks within the Long trend make it all a bit dicey, albeit gold did recover 10 points from its post-payrolls plop into the 1160s yesterday. Also, of the four "three-in-a-row" downside week stints since one year ago-to-date, three of them were then met with an up week; 'twould be nice to have that recur here, (and can we dispense with the closing of the eyes, please?):
'Course, 'tis not just gold that's been taking it on the chin, mind you, for with only the bare exception of the S&P 500, the other seven of the eight BEGOS Markets (Bond / Euro and Swiss / Gold, Silver and Copper / Oil / S&P) are in negative 21-day linear regression trends, bringing to mind then Vice Presidential candidate Al Gore's infamous 1992 whine that "Everything that should be up is down!" Certainly in monetary context, at least gold ought be up, if not Sister Silver as well to the extent that she's not become overly-strangled by economically-negative Dr. Copper. Still, the following graphic of the eight BEGOS Markets' respective daily bars over the last 21 trading days (one month) is presented not so much for clarity of detail, but simply to show that their grey diagonal linear regression trend lines, save for the S&P ("SPOO"), are all declining. The "Baby Blues" are the dots that reflect the trends' consistencies:
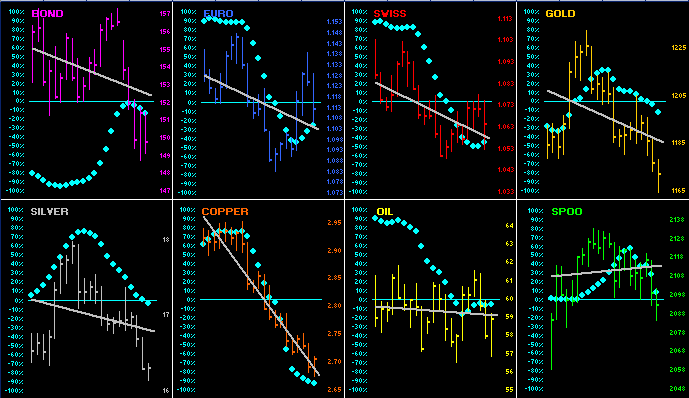
Again, of particular note in the above graphic is Copper's current steep trend decline. 'Tis said that Copper has lost the status as a long-standing leading economic indicator, its having been sold off for four years now, (from $4.6295/lb. in 2011 to today's $2.7020/lb, some -41.6%), whilst the stock market throughout has been climbing and unemployment falling as the economy improves. That, at least, is what they're telling us...
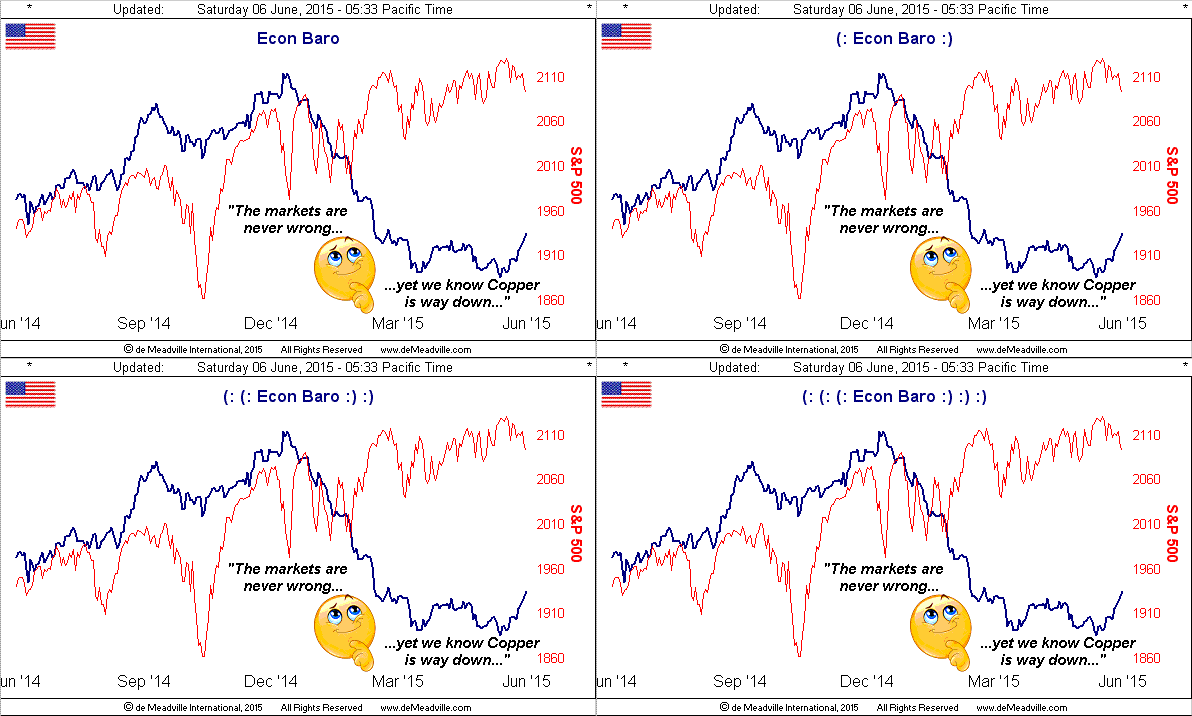
...versus what the Economic Barometer is showing us. Moreover on a global basis, the Organization for Economic Co-operation and Development, in cutting growth expectations, has graded the world's economy now at a "muddling through" B-Minus. Manufacturing activity in May showed little sign for growth in both Europe and Asia as demand remained weak. Further, the International Monetary Fund says that StateSide, the Federal Reserve Bank ought delay an interest rate hike until the first half of next year. In addition, the ever-ebullient Marc Faber this past week reiterated his seeing Quantitative Easing Part Four sitting out there. So in 2016, given the above Econ Baro and as we've said quite straight arrow, might the plea instead be for "QE"? We'll see.
In the meantime for gold, the status quo rationale remains rampant to Short (as opposed to "Sell"). Such brilliance continues to emanate from the same bunch that believes the economy is strong, the price/earnings ratio of the S&P is only 18x ('tis actually 33.7x at this writing), and that at the end of the day, Gold really is so déclassé. You know the feeble excuses as well as do I, that given "dollar strength" gold cannot rise (wrong), that given interest rate increases gold cannot rise (wrong), that given the stock market only goes up gold cannot rise (wrong). So many reasons to Short Gold, non? We've but one reason to be Long Gold in spite of its own supply having almost doubled since 1980: the first integral ("M2") of our currency alone is up sixfold; that of the €uro totals €9.8 trillion; then include derivative claims and the global money supply has essentially "googolpuled". That's our reason: write it down.
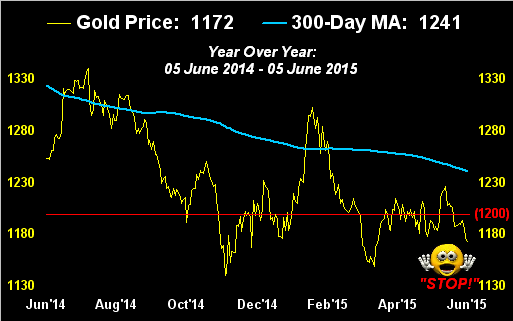
Does such debasing of that by which we value our worth make manifest claims of gold getting to the gargantuan levels of which we hear above $50,000/oz.? I'm merely looking for a comparably tiny $2,000/oz. Peanuts, that. And yet, 'tis become like pulling teeth for price to even reach up to touch its 300-day moving average, which as we next see in this year-over-year view at 1241 appears well above what ad nausea has become gold's flight ceiling at 1200 (red line), let alone the current 1172 level. As for the Shorts? "Stop!", say we. The sooner we can scare 'em to into buying, the sooner gold can get a grip and resume climbing:
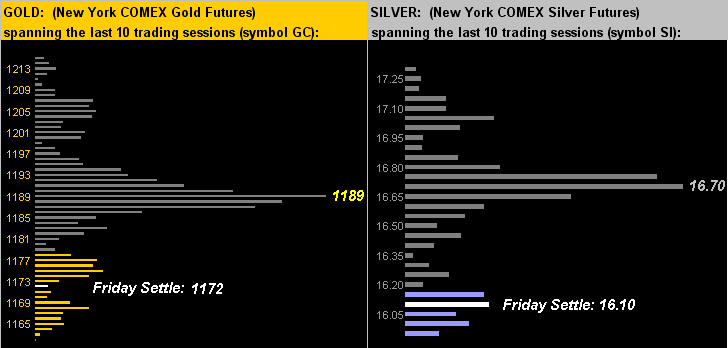
As for the near-term Market Profiles for both gold on the left and silver on the right, their pictures are nearly identical, but with the promise of support a week ago now having turned for the present to resistance. Still in the center of both panels, as was the case last week, are the most commonly traded prices covering the recent fortnight; but now the trading has shifted from having been above the respective prices of 1189 and 16.70 to below them, (Friday's trade being the coloured swaths in both panels):
Next as we look forward to the ensuing week, especially with respect to the very recent run of some recovery in the aforeshown Econ Baro, incoming data on retail sales, wholesale inflation and sentiment are "expected" to have picked up. This data is back-loaded into the last couple of days of the new week, so that's when we'll next see if there's any notable move in the Econ Baro. And there is some concern that if people aren't spending, the economy won't grow. True enough, to be sure, but then, why aren't we spending? One senior economist went on record this past week to note that we're saving too much. That's right: our savings rate today at 5.6% is practically double that of pre-recession levels. Heaven therefore forbid we return to saving rates typical of the 1980s at 8%-to-12%, (during which decade the economy sustained real growth!). Better not let that cat outta the bag.
Finally this word on Greece. Apparently they've come up with a scheme to not pay the IMF on time, yet avoid default. Funds were due the IMF yesterday, and oh yes, Greek Economy Minister Giorgos "The Deck Is Stacked" Stathakis said they had the money to make the payment, but why pay now if they can bundle four payments into a €1.6 billion lump sum due at month's end? (Don't try this with your mortgage lender). Then, of course, comes July, August, et alia. Gold may for the present be "Sucking in the Seventies", but one gets the sense that at some point €uros shall be sucked out of Greece to be replaced with Drachma. Fitting that some of such coinage traditionally has been minted with a hole in it: