Gold, Silver, Oil Weekly Analysis
Gold Weekly Review
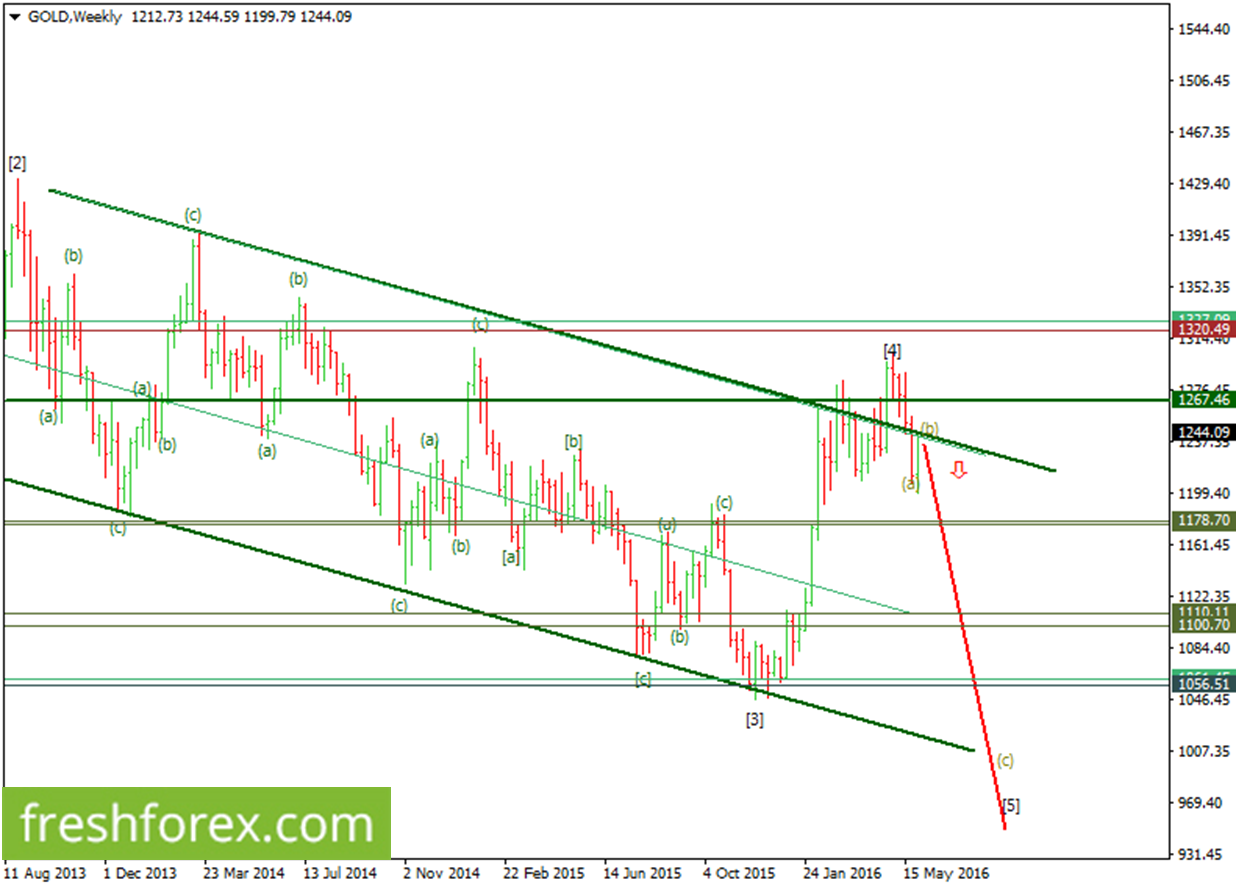
During the previous week ending June 3rd 2016, instead of going short as previously forecasted, gold markets retraced massively to the upper side following the NFP results but could not close above the upper resistive trend line forming on top of the falling channel.
Although we expect further rally to the upside, we will only be keen to buy this commodity upon a clear break above $1257. The anticipated long positions should have targets at $1279, $1292 and $1320.
However, as long as the the upper resistive trend line protects the upper side, we expect a corrective rally to the lower side, but should not go below the middle green supportive trendline.
Gold should be traded alongside silver; these two commodities have similar price action and will move in a similar direction during the week.
Trade Recommendations:
As long as the pair trades below the upper resistive trend line, expect a rally to the lower side with a target along the middle supportive trend line. Buy positions are only recommended upon a clear break above $1257 with an ultimate target at $1320.
Silver Weekly Review
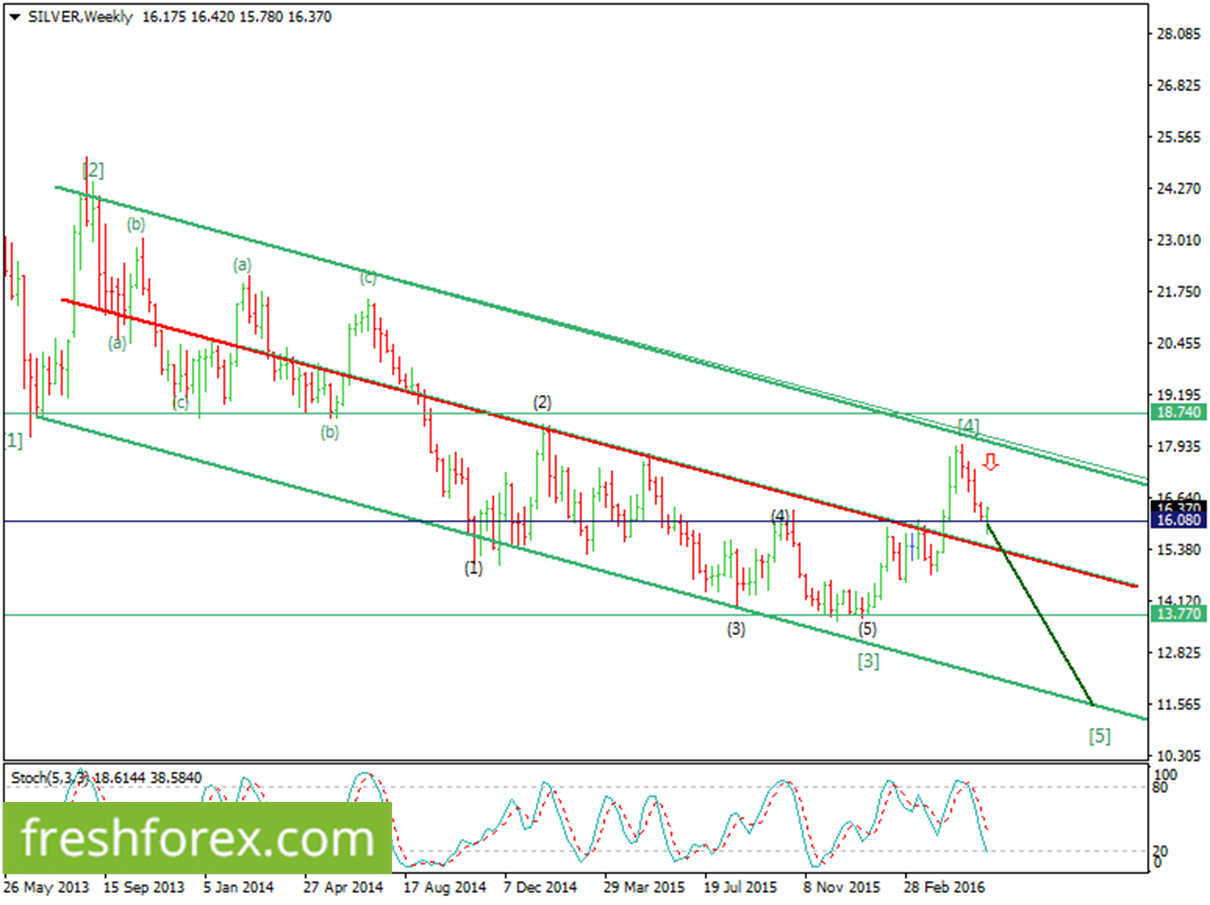
During the previous trading week ending June 3rd 2016, silver traded short as previously forecasted, but ended up forming a possible reversal candle on the weekly chart during the NFP.
Although we expect further movements to the upper side, we are waiting for a bullish confirmation candle to close above $16.53 to go long, with our targets at 16.91, 17.28 and the next target at 17.79.
This view remains valid as long as the pair trades above 15.84. A clear break below this this level (15.84) will lead to an acceleration to the lower side but should not go below 15.17.
Silver should be traded alongside gold; gold and silver have a strong positive correlation of up to +0.89 and will have similar price action in the week ahead.
Trade Recommendations:
Expect movements to the upside, though they should not go above the upper trendline. However, a clear break below 16.08 will mean looking for short positions with an ultimate target at 13.77.
Crude Oil Weekly Review
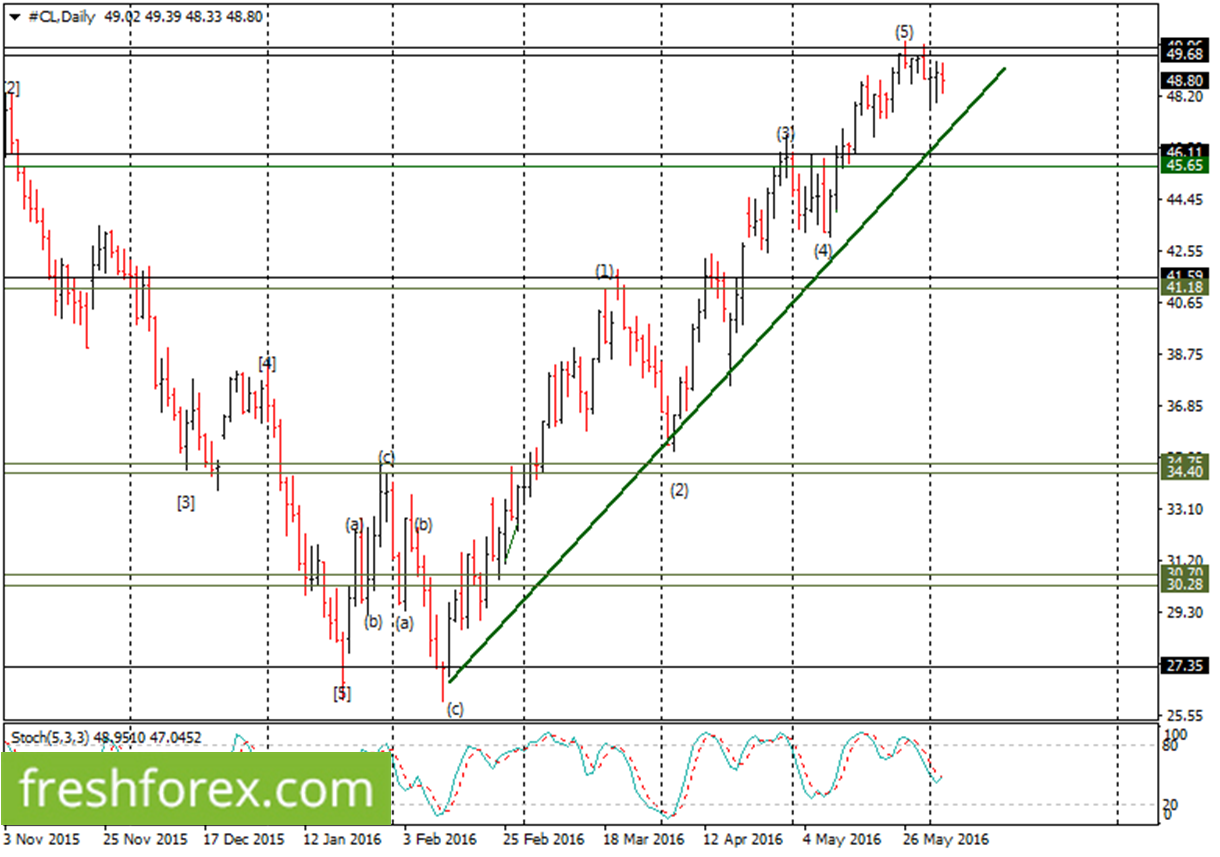
During the previous week ending June 3rd, 2016, crude oil struggled below the resistance level 49.68 and ended up closing below it.
During this week, we expect a corrective three-wave cycle to the lower side with wave (a) ending along the lower supportive trend line. A break below this target will lead to acceleration to the lower side but should not go below 46.11.
This view remains valid as long as the pair trades below 49.68. A break above this target will push the price to the upside but should not go above 61.30.
Trade Recommendations:
Expect an acceleration to the lower side this week. Remain short with your target along the lower supportive trendline and 45.65. Buy positions are only recommended above 49.68 with your target at 61.30.
