Long time readers of The Gold Update have come to learn that our microphones are just about everywhere, even aboard Gold's ongoing flight at (what was) 1200. To wit:
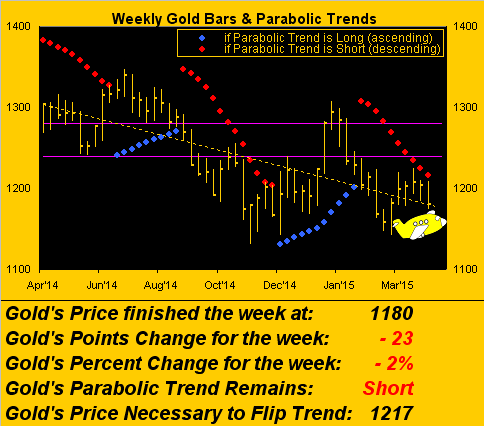
"Uhhh, ladies and gentlemen, this is Captain Endicott speaking: you may have noticed we're in a slightly descending pattern-hold here at 1180. The parabolic front ahead of us at 1217 is expected to produce the usual turbulence such that we've flipped on the seat belt sign and kindly ask that you return to your seats and buckle up. This has put us in a bit of a delay toward crossing the front, where currently, conditions are reported to be more uplifting. As for those of you seated on the left side of the aircraft, the crop formations over which we're passing look uncannily like '34.5x', which actually is the present P/E ratio of the S&P 500. So even the extraterrestrials are trying to get the word out. Anyway, we appreciate your patience and ask that you call on our friendly flight attendants should you need anything. And thanks, as always, for flyin' with Gold..."
So as we go to Gold's Weekly Bars, here's what the Captain sees: the descending series of red parabolic Short dots came close to being eclipsed by the week's high (1209 in the rightmost bar) before running into three nearly identical air pockets, each of a duration of some 15 points at around 04:00 Pacific Time on Monday, Wednesday and Friday (yesterday). All three down-drafts were then met with a modicum-to-moderate amount of uplift, the week nonetheless ending for Gold at 1180, just six points above its low of 1174. And as noted in the lower panel of the graphic, the "front" to cross so as to make the trend Long is now the flip price of 1217:
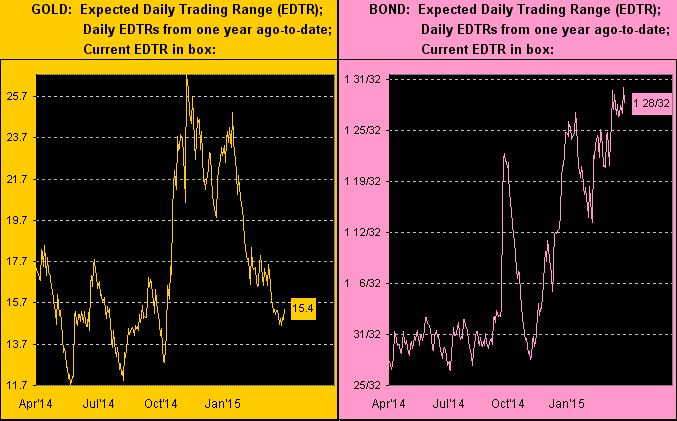
The Gold trade this past week was nothing Short (pun) of cantankerous if not just outright messy, for in brooding over the day-by-day action 'twas as if nobody really had a clue as to what to do. Even Gold's more reliable technical signals were in conflict: early Wednesday we had a buy signal confirmed on Gold's 12-hr. Price Oscillator study which was then mitigated the same day with a confirmed sell signal on the daily MACD study. Indeed, all this recent flying along either side of the 1200 level has really compressed Gold's "expected daily trading range" (EDTR). Here 'tis on the left from one year ago-to-date, compared with that on the right for the Bond which has really ramped up its own "ranginess". Again, these EDTRs are not price direction; rather they are the measures of expected intra-day volatility, Gold's having ironically gone somewhat back to sleep as Geo-Jitters, Grexit and Grate (pun) Expectations boff the Bond about, tossing it this way and that whilst expanding its daily trading range:
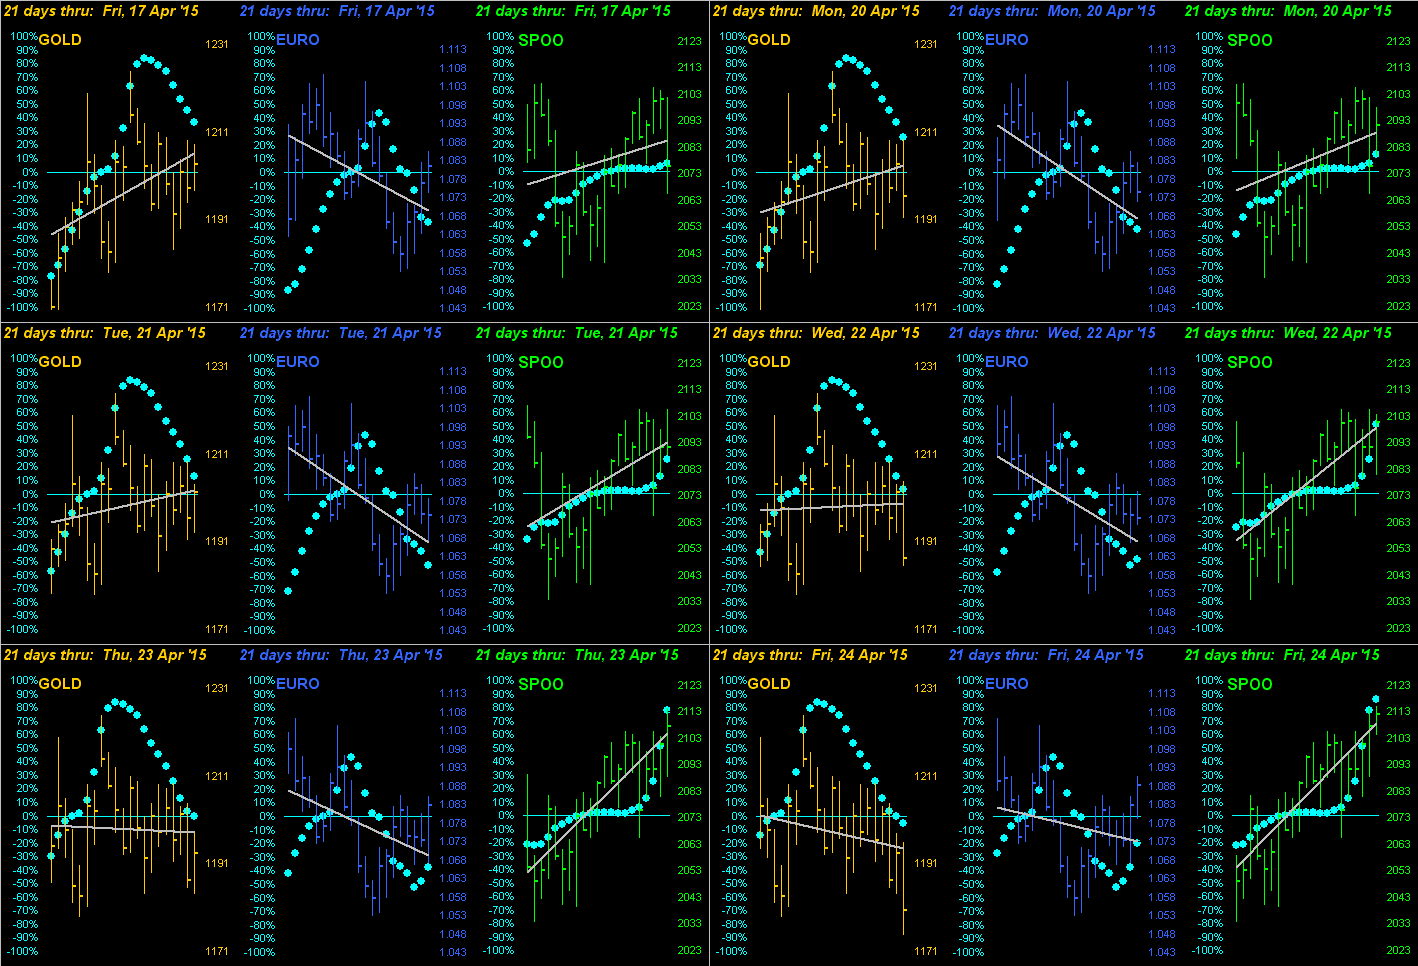
In fact, let's next update the following chart -- in looped animation for this presentation -- from one week ago when we quipped "Of the three, where would thee prefer to be?" through yesterday. We've gold (left) in decline, the euro (center) rising, and another lousy Q1 earnings aside, the S&P (right) also rising, (despite a FinMedia headline this past week that stated "Dollar’s rise casts shadow on US earnings", albeit the dollar Index declined through much of the week to close lower at 97.100: 'twas 100.270 two weeks ago). The diagonal line in each panel is the 21-day linear regression trend of the respective market across as many days, and the "Baby Blues" are the dots that denote the trends' consistencies:
"But mmb, earnings are beating estimates all over the place..."
Squire, you ought well know by now that "estimates" are quite often not "improvements". Go to our Earnings Season page and you'll deduce that 40% of reports thus far have not bettered their bottom lines, and yet the stock market is making all-time highs. (Refer back to Captain Endicott's crop formation comment). In fact, the last Earnings Season wherein at least 60% of companies bettered their year-over-year quarterly results was for Q2 of 2011. They've not been pretty, but then they're not reported upon as lacking material growth en masse. Beating estimates is all that matters. And dumb and dumber translates into higher and higher. (To be sure, there is good value amongst certain individual constituents in the S&P 500, as you can peruse via our "Valuations and Rankings" page; but the Index as a whole is frightfully beyond expensive).
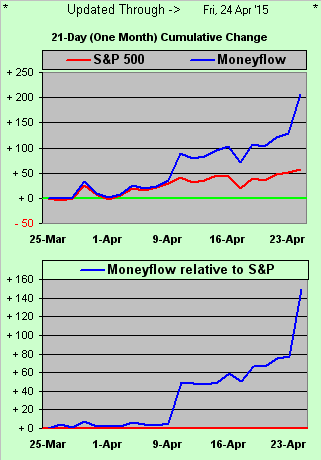
Having said that, folks regardless are throwing money into the market. Here for the last 21 days is the cumulative points change in the S&P 500 (red line +57) vis-à-vis its moneyflow regressed into S&P points (blue line +206!). The lower panel in the chart is the difference between the two, "suggestive" that the S&P (currently at an all-time closing high of 2118) ought be higher still by 150 points up at 2268! Might this ~finally~ be the stock market blow-off? Remember: by old fuddie-duddie price/earnings ratio standards, halve the Index and 'twould still be expensive...
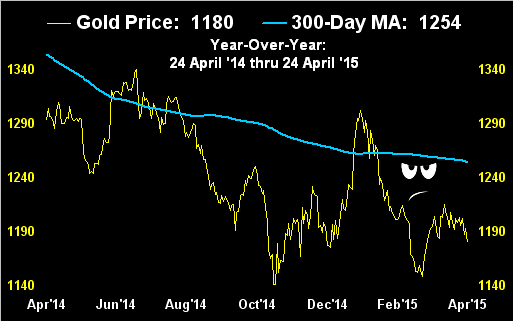
...course Gold right now at 1180 is half of what it "ought" be, but shame on us for being rational and wrecking all the euphoria goin' on out there. Indeed what's as un-euphoric as can be is Gold's tried-and-true ally, the once stalwart supporter of price known as the 300-day moving average, these days really getting the evil eye in the role of resistance:
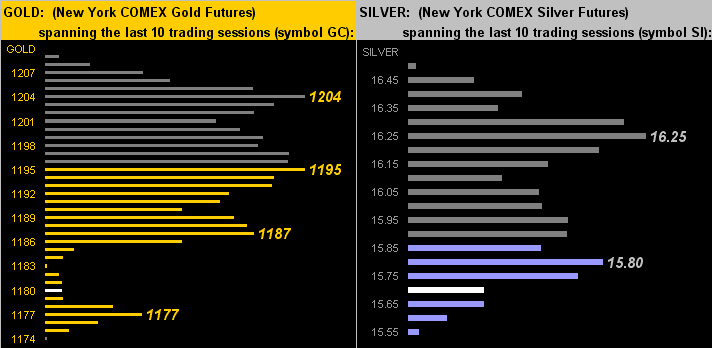
And as for the "now" in turning to the 10-day Market Profiles (contract volume per price point) for both Gold (left) and Silver (right), we see Friday's closing prices -- the white bar in both panels -- well near the bottom of the ranges. At least Gold has some indicative support there at 1177; but Sister Silver may have to throw off her precious metal pinstripes, not for her industrial metal jacket (for Cousin Copper had quite the firm upside session yesterday without Sis following along), but rather succumb herself to being suited up in a straight jacket over at the looney bin:
Never in memory have the world's great markets that comprise BEGOS (Bond / Euro & Swiss/ Gold, Silver & Copper/ Oil / S&P 500) seemed so 180° out of whack as they today appear. Or perhaps more rightly stated, they've simply become wacky.
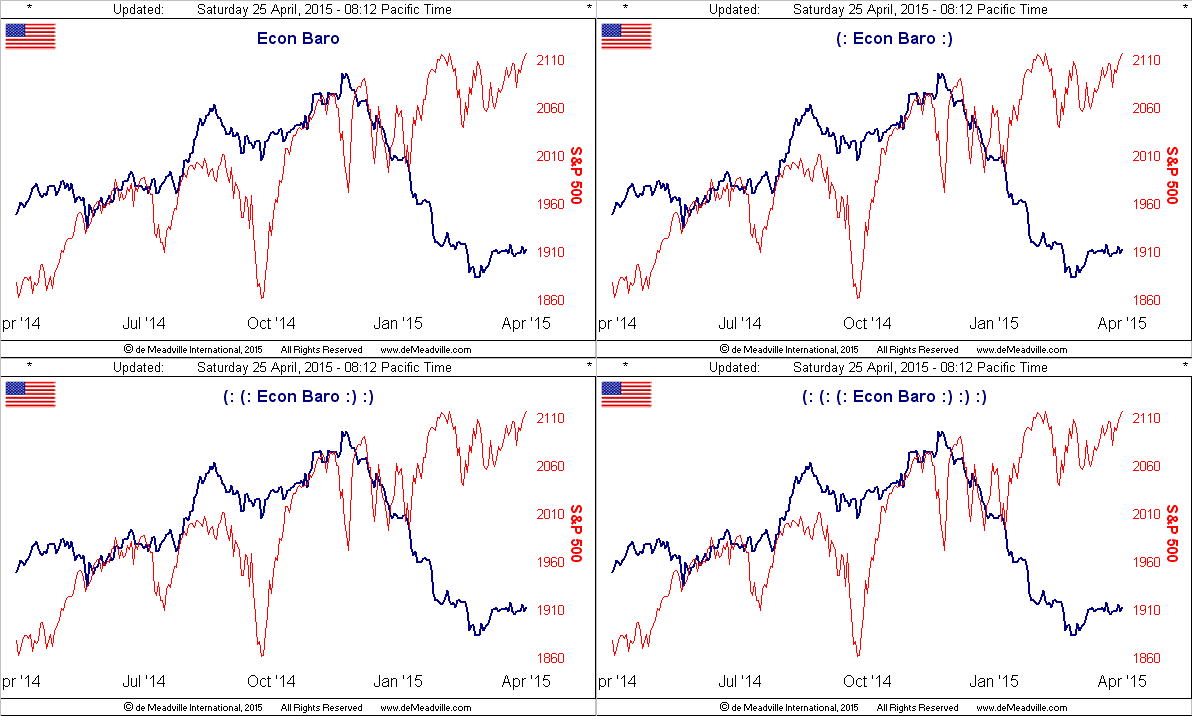
Meanwhile the EuroZone Yo-Yo continues bouncing about, for in spite of German business confidence rising to a 10-month high in April, firms and investors are turning less optimistic about their forward outlook. Further, EuroZone business activity as a whole in April ebbed by more than the worst forecast expectation, whilst manufacturing in both China and Japan also slowed down. Then there's our neck of the world's woods, which truth be displayed, shows we're hardly picking up one economic wit:
So as we slog through what is seemingly Golden Muck into next week, we leave you with these three notes:
1) 'Tis a fairly stout week of incoming Econ Data that awaits us, including a Policy Statement due Wednesday (29 April) from the FOMC, sans "press conference", which shall in turn keep Grate Expectations pinging to and fro, as into month's end we go.
2) What ought we make of one Navinder Singh "Flash Crash" Sarao? It doesn't look good for The Spoofer and rightly it ought not based on the evidence collected to date. Still, I'm sure many of us traders have placed orders (albeit of far more minimal size) into the market, only to pull 'em out at the last minute -- not to spoof, mind you -- but for fear of actually getting filled because what had looked like the right thing to do suddenly didn't! Nevertheless, notwithstanding the almost two dozen charges against Sarao of wire and commodities fraud, if the trading platform he used allowed him to do what he did, one would have to say "Guilty by Brilliance!"
3) Finally, as we opened by parodying Gold in flight, as well as having made mention of Q1 Earnings Season, we note there is much excitement over certain StateSide air carriers' first-quarter results. Well I should hope so: the average price of oil by the barrel in Q4 was $73.39 vs. just $48.60 in Q1. Yet as we've recently remarked, air fares themselves haven't really seen much if any savings passed on to the customer. For flights that zoom across the pond, I regularly research fares and they seem higher year-over-year than lower. But you know what they say, especially given that fares can be demand driven: "When you gotta fly, you gotta fly" To which we respond: "The flight to Quality is the flight to Gold". I 'spect Captain Endicott will soon clear that onsetting parabolic front and improve our altitude ... and in turn aggravate the Shorts' attitude!