
Weekly Review
In this week’s video we do a complete Elliott Wave analysis of the four markets covered – S&P 500, EUR/USD, oil and gold and show how to trigger trades and get validations at market turning points.
In the past Global Markets Analysis Webinars, we have followed the risk on/off stories by looking at oil, stocks, the EUR/USD (as a proxy for the dollar) and gold. Hence, we have looked at the market correlations to see the intermarket analysis playing out in these four asset classes. It is without a doubt that the current market environment is heavily reliant on tracking US economic data, as well as the timing of when the Fed will hike rates. On top of that, we made the case that the stability of the price of oil was a key factor in deciding the trajectory of higher interest rates, and therefore have argued that equity traders must also follow the oil market. With that said, currencies such as the USD/CAD and the AUD/USD can also both be used as viable instruments to track the overall sentiment for commodities Alongside favorable commodity prices that will assist in reaching the Fed’s 2% inflation target, the central bank is also extremely reliant on economic data to target domestic growth in the US.
What are the 3 points to discuss this week?
OIL
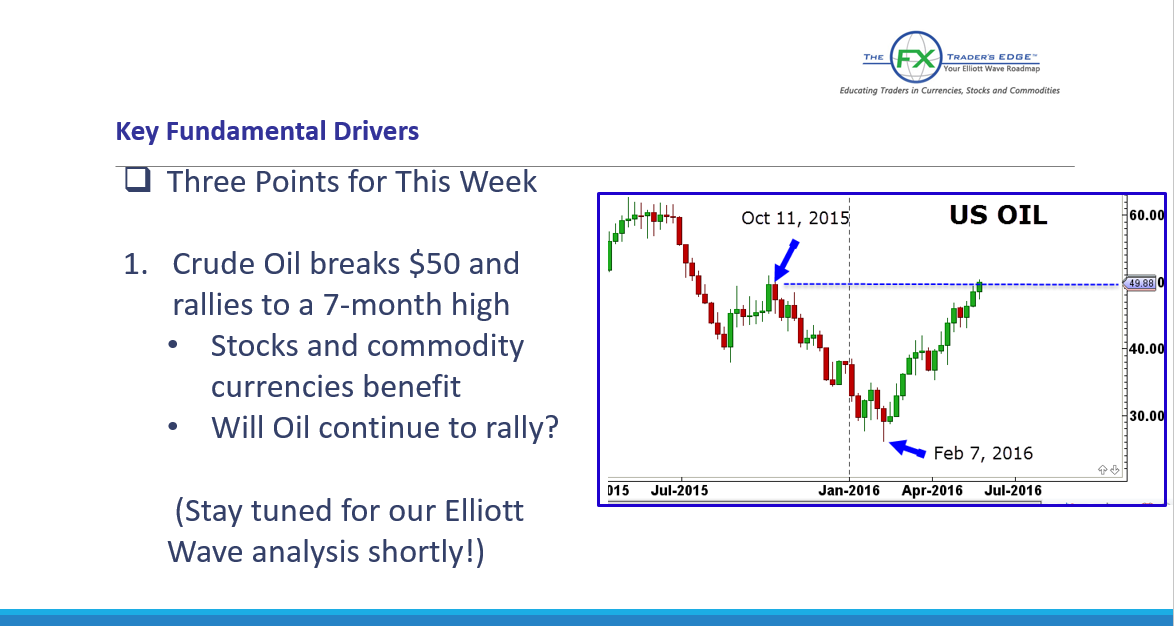
Crude oil finally broke above the psychological $50 level, and rallied to a 7-month high. As shown from the chart above, the last time oil had traded at $50/ barrel was on October 12, 2015, and should prove to be a critical area to break through going forward.
The rally came after the EIA reported that US crude stockpiles, which are near an eight-decade high, fell by 4.2 million barrels last week compared to expectations for a drop of 2 million barrels.As a result, oil prices continued to rise on Wednesday while gains in energy shares lifted global stock indexes.
Nonetheless, OPEC continues to produce at near-record levels and is unlikely to set an output target at the June 2nd meeting as it sticks with Saudi Arabia’s strategy to out produce their rivals – ultimately capping oil prices for the time being
Stock and commodity currencies benefited this week as well.

This is a chart of the S&P with the price of oil overlaid. After the EIA data was released (initially oil sold off), oil jumped and stocks continued to move upgiven that the drop in inventories was larger than expected. Earlier today, oil retreated from the $50 level and the S&P retreated as well.

This is a chart of the USD/CAD with the price of Oil overlaid. After the EIA data was released, oil took off and the USD/CAD, already off the highs, traded down 140 pips during the course of the day, and then another 100 pips overnight. Thus, it is extremely beneficial to follow both instruments closely as they were both impacted by the report.

This is a chart of the USD/NOK which is also highly correlated to the price of oil.
FED RATE HIKES
Luckily for the Fed, financial markets have been much less volatile compared to the start of 2016 and have thus mitigated the anxiety for plans for potential rate hikes during June’s meeting.
After the hawkish tone from the Fed’s April meeting minutes, the markets seem to have grown comfortable with the elevated odds of a rate hike. Traders are now giving roughly a 32% chance of the central bank increasing borrowing costs at its June meeting, with Fed officials lining up to indicate their willingness to support such a move, should the upcoming economic data warrant doing so. Fed Chair Janet Yellen will speak to the public on Friday, and will allow investors to get a better grasp of the monetary policy decision-making process.
GOLD VERSUS US DOLLAR

Gold continued to drop this week with the prospect for higher rates closely approaching. Gold is off from its highs of 1,303 and traded as low as 1,218 yesterday, down $85 from its highs. The EUR/USD and gold are tracking each other as they should. The historical and traditional relationship which has held up over time, is that as the dollar goes up, Gold drops. When the dollar goes down, gold rallies.