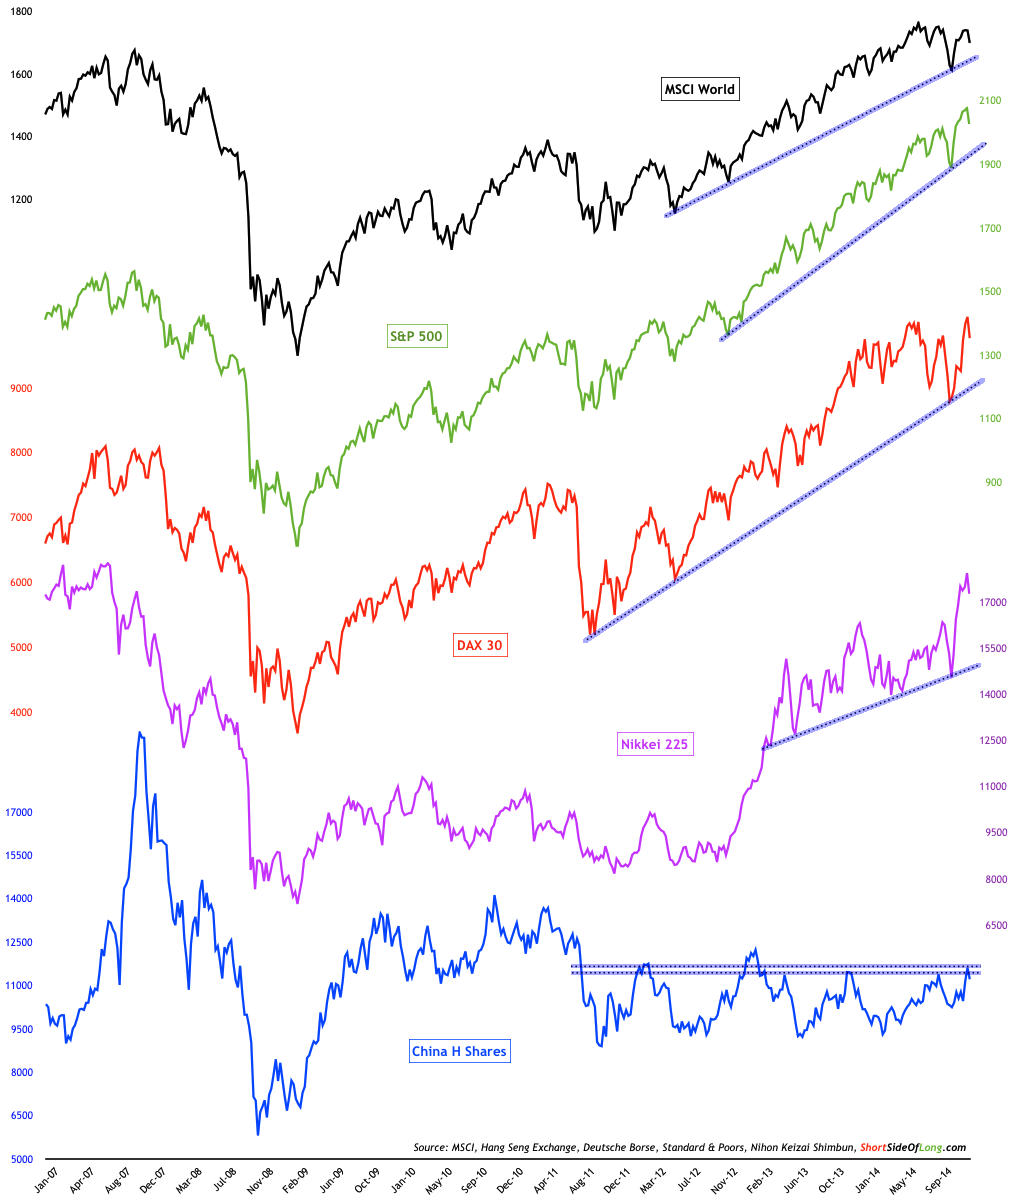
Chart 1: Global stock markets have been volatile since summer months
The stock market correction has been with us since the summer months of this year. US centric readers will probably be thinking what the hell is he on about, because only several days ago, the S&P 500 was trading at record highs. However, focusing on the global picture, we can see the situation is slightly different.
Chart 1, above, shows major equity indices from the largest economies around the world. We have USA, Germany, Japan and China (HK listed Chinese shares). Over the last few years, the US has been a strongest leader and out-performer, while China has been a laggard stuck in a prolonged consolidation pattern. From the shorter term perspective, Japanese stocks have gone through the roof in recent weeks. Apart from China, all major developed markets are at or near bull market highs.
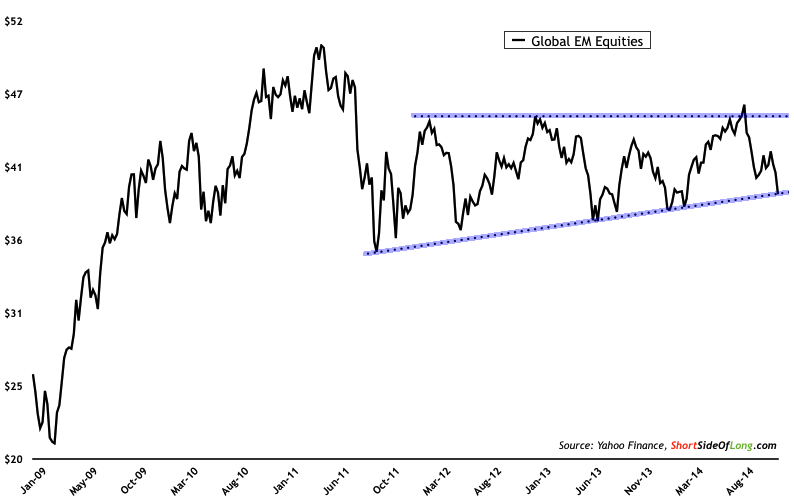
Chart 2: GEMs stocks are down 14% since the beginning of September
The picture isn’t as bullish elsewhere, however. Consider that emerging market stocks have been under pressure since the start of September and are currently down 14%. This stock market is quite cheap and has recently fallen on an important support line. It will be interesting to see if buyers step in at this level or if we are about to break down even lower. Now, judging by recent blog comments, most readers might assume that buying emerging markets is not wise and there is a reason why they are cheap.
Fair enough. But if someone were to tell these same readers that US stocks will also drop 14%, just like their emerging market counterparts, all hell would break loose followed by a huge argument. Since both S&P and GEM indices are priced in US dollars, remember that we are comparing apples and apples instead of apples and oranges.
So… let us imagine a 14% correction in the S&P 500 from its September highs. At the beginning of September, US equities were trading at just about 2010 points so a 14% drop would mean a current price of 1,730 points. This is almost unimaginable for most people who have become used to record high after record high in the US.
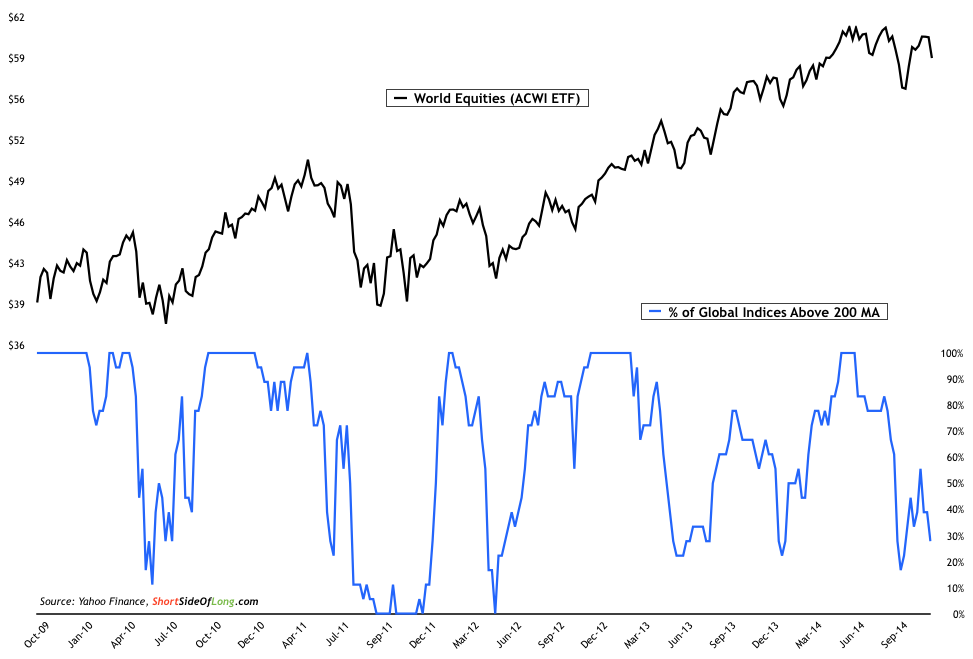
Chart 3: Only 30% of global equity indices are trading above the 200 MA
Finally, according to all of the major indices I follow in my personal data, only 29% are trading above their respective 200 day moving averages. This is also confirmed by the MSCI World Index, which itself peaked in June of this year and currently trades below its 200 day MA as well. Out of its most important components, only the US, China, India, Turkey and Thailand are still considered to be in an uptrend.
Note: all index data is priced in USD and from MSCI.


