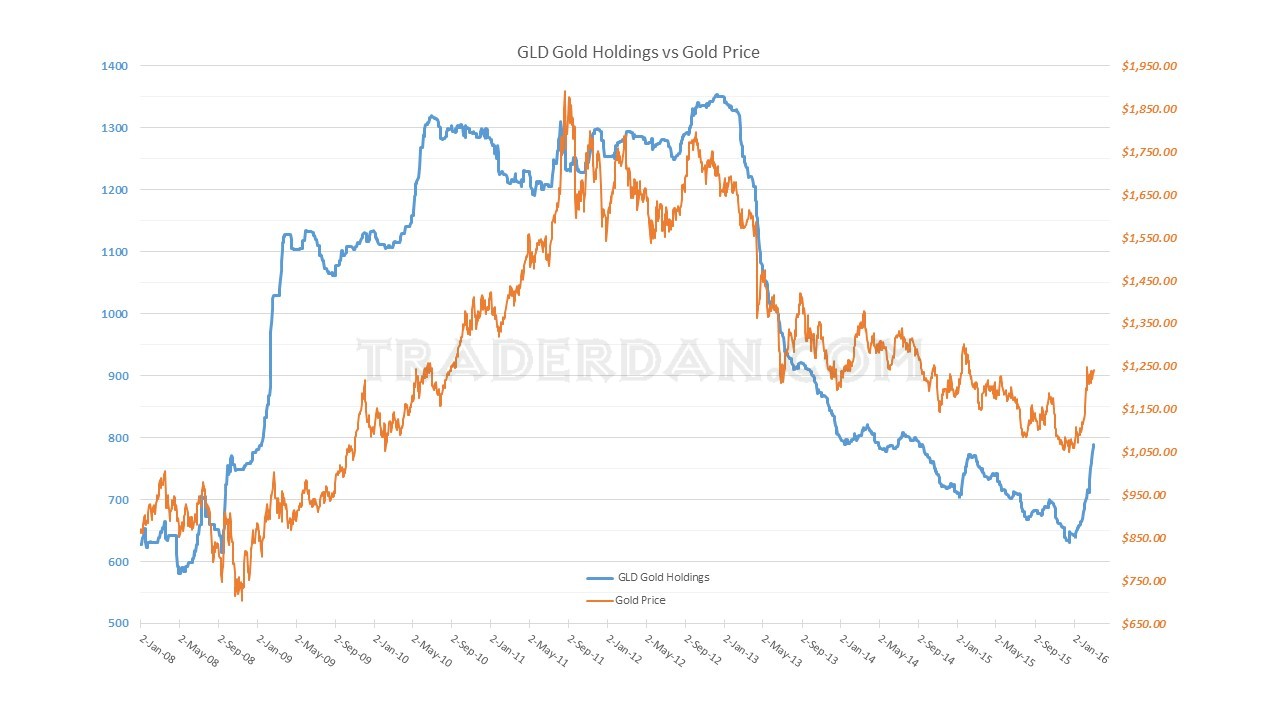
The continued build in the number of reported gold holdings in the large gold ETF, SPDR Gold Shares (NYSE:GLD), is nothing short of phenomenal. This week alone, another 22 tons of gold have been added to the ETF bringing the total in storage to 788.6 tons.
Here is a chart showing the sharp increase in holdings.

This is the largest amount of gold in GLD since September 2014.
I have been watching very closely that continued build in speculative long positions over at the CME against the growing short position among the Commercials and Swap Dealers and have been growing increasingly concerned about that imbalance now that gold is moving sideways at its current levels.
However, this continued build in GLD is ameliorating somewhat those concerns as it shows continued very strong demand here in the West for gold.

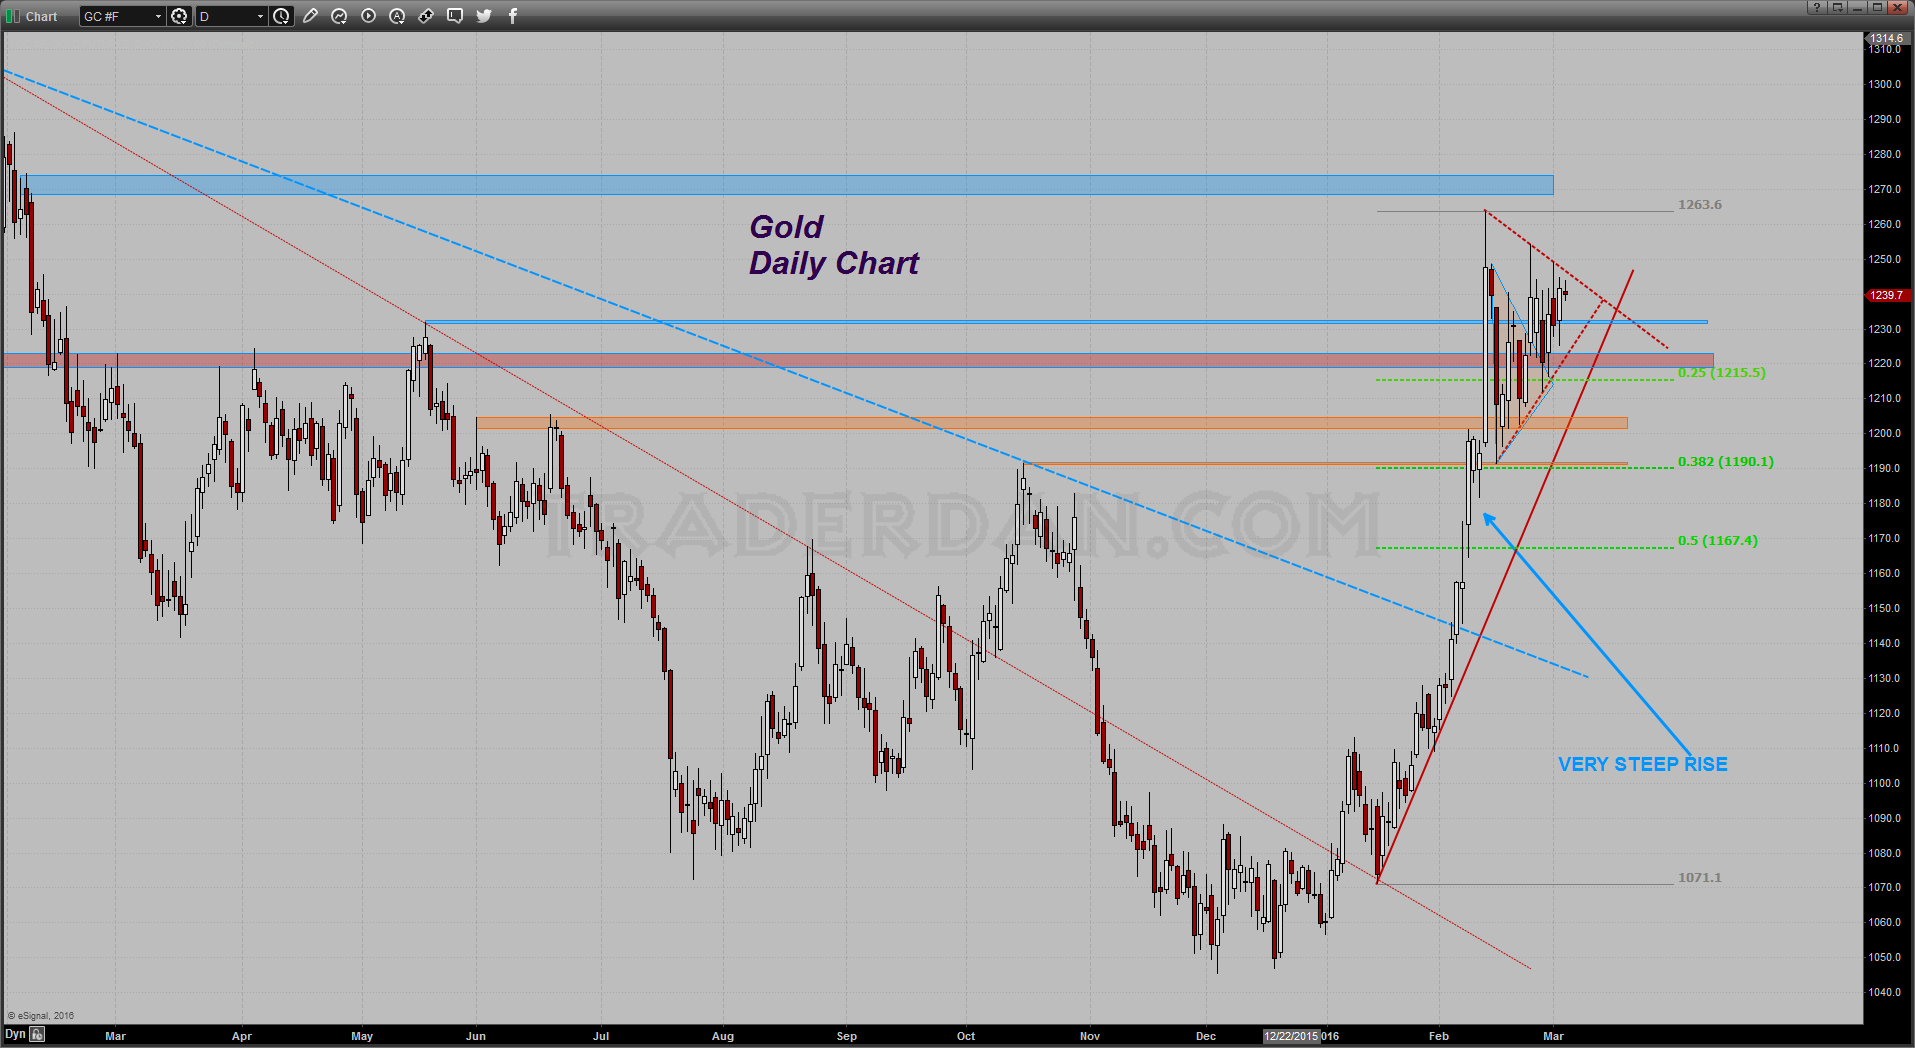
At this point I am not sure whether gold is moving higher for safe haven reasons, currency woes, or what, but it is evident that demand for the metal remains firm, firm enough that the metal continues to coil on the chart. The coil is tightening and the direction is towards the upper end of the coil which would put the odds more in favor of an upside resolution of this coiling/consolidation pattern. I would like to see a CLOSE above $1250 to feel more confident that the market has some further upside left in it.
If you notice, the market has NOT CLOSED above that level yet in this recent upswing. A close through $1250 would not only put it outside the coil but it would also be the best closing price in thirteen months if it could accomplish that.
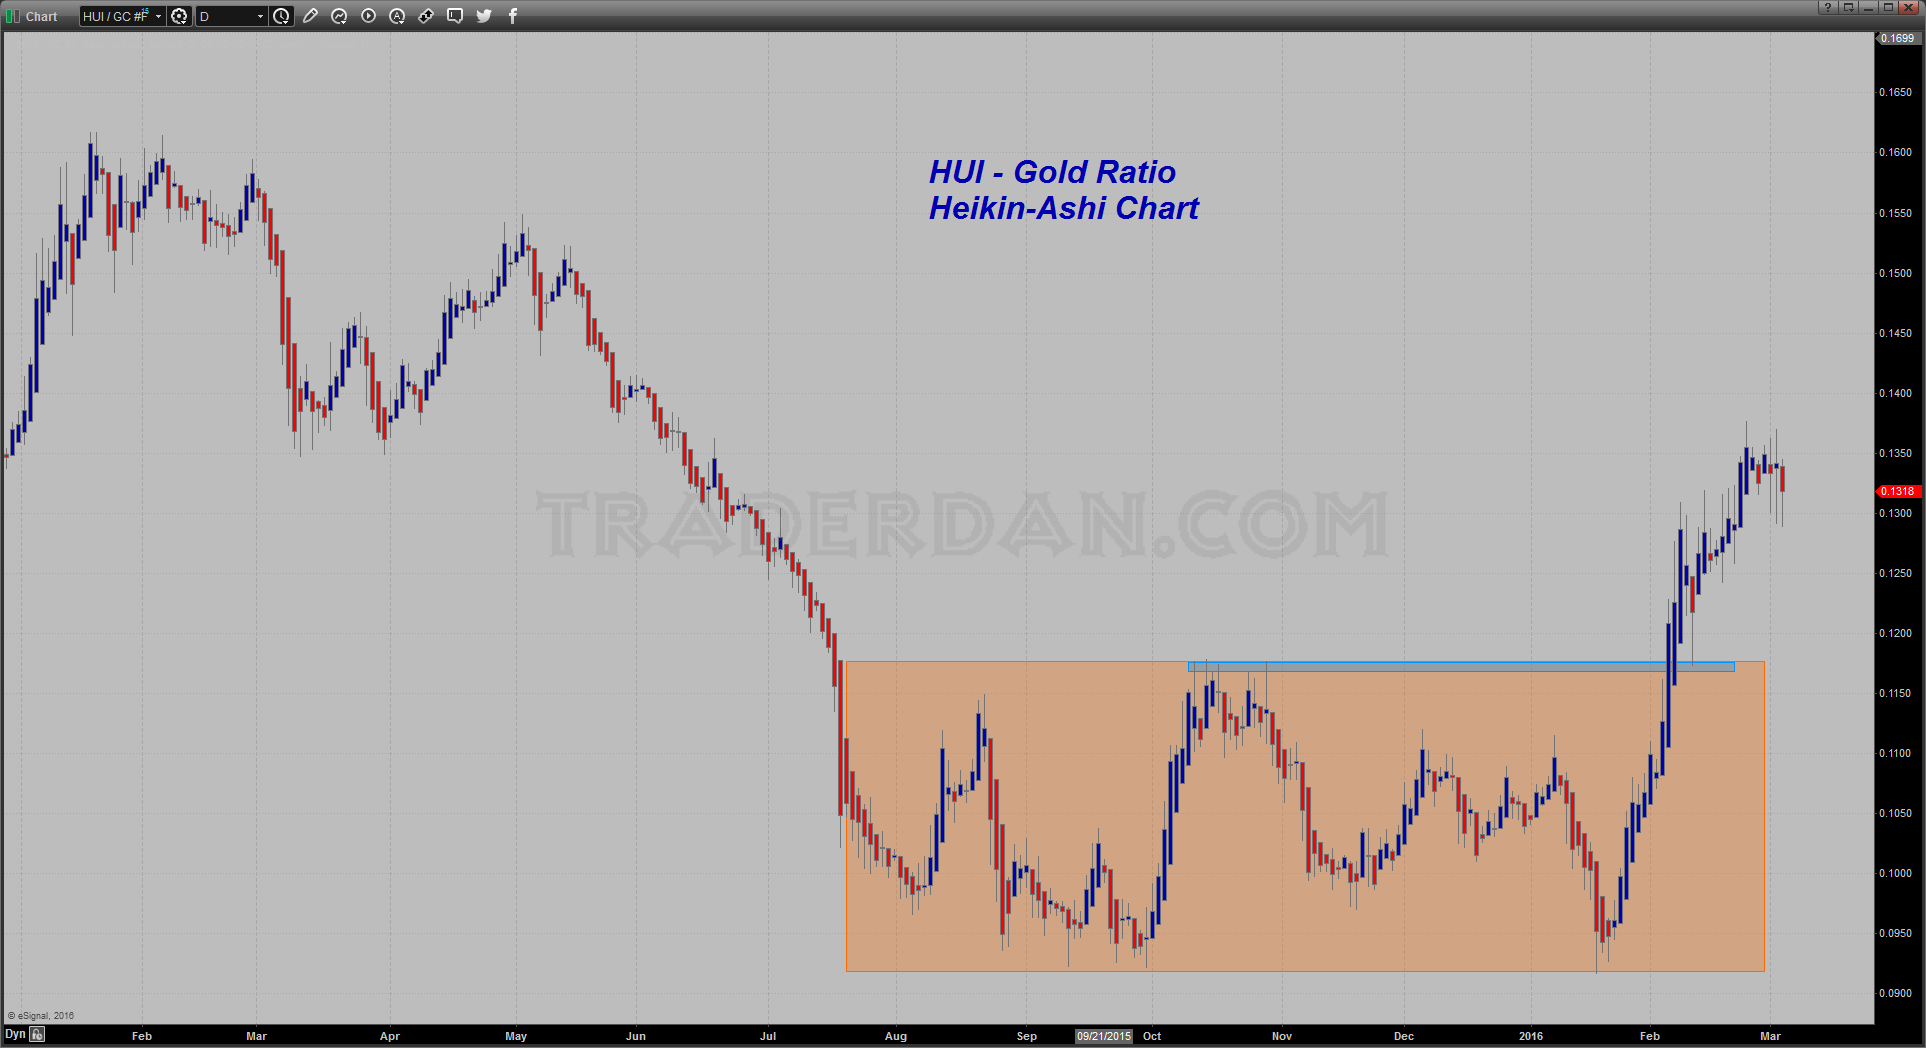
The HUI/Gold ratio has set back from its best recent levels and is showing some signs of stalling out here so this will need to be monitored and weighed against what is happening in GLD.

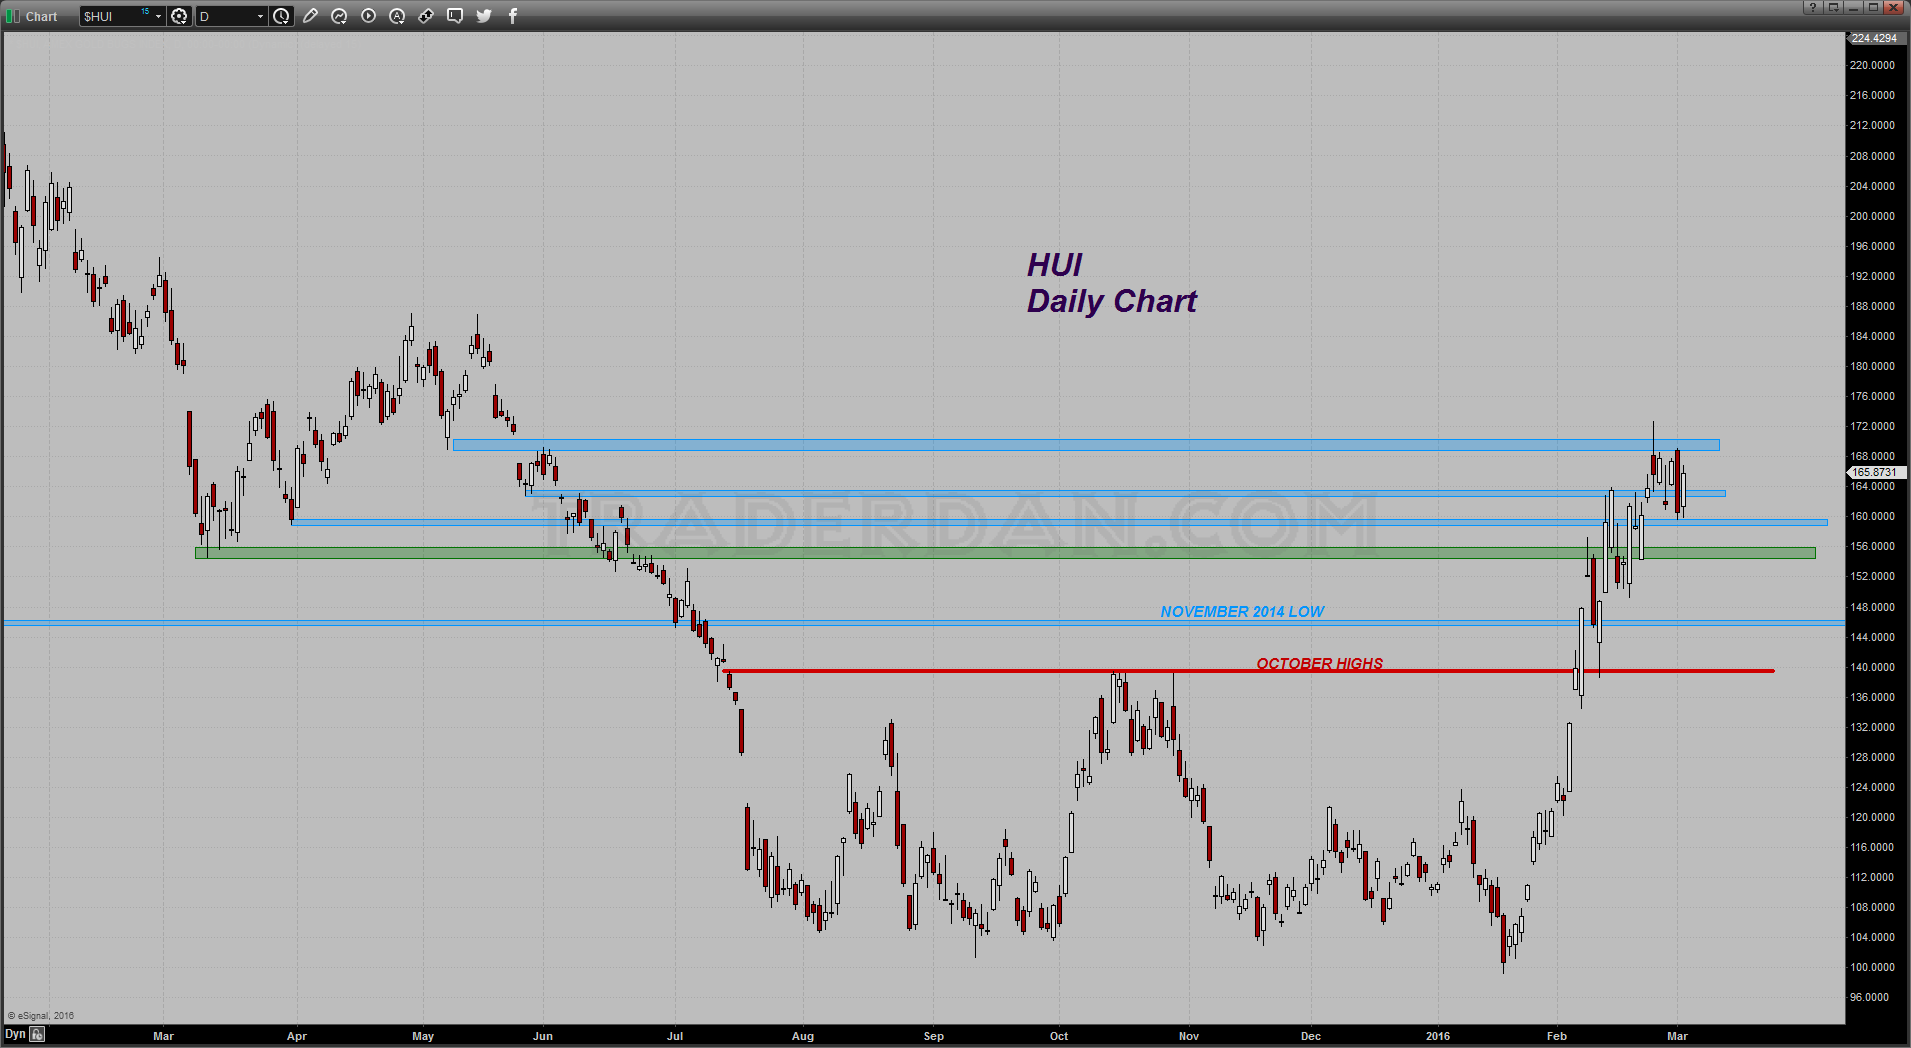
The HUI itself is hesitating below 172 but it is holding support at this time.

So far all of these various indicators that we are monitoring to track gold and the factors that might be moving the price are showing no signs of any serious breakdowns. There is hesitation however to move higher and that means we will more than likely need some sort of fresh stimulus to break this logjam.
The big thing for me is whether or not that heavy speculative long position will remain put or grow impatient and liquidate. As long as GLD stays firm it should limit the downside and keep prices within a consolidation pattern in spite of the imbalance in the futures market but if GLD shows any serious signs of drop in reported gold holdings, I would expect to see some of these longs head for the exits.
