
Shares of G-III Apparel Group, Ltd. (NASDAQ:GIII) surged 69.1% during the trading session on Mar 19, following impressive fourth-quarter fiscal 2020 earnings results. Strength in the Calvin Klein, Tommy Hilfiger and DKNY brands has been a major boost. Moreover, the company’s e-commerce business is performing well, with DKNY and Karl Lagerfeld recording double-digit sales growth. Moving along, management is on track with the restructuring of retail operations, which will bring down the number of stores and consequently cut losses from underperforming locations.
G-III Apparel expects to continue leveraging strength in its global power brands — DKNY, Donna Karan, Calvin Klein, Tommy Hilfiger and Karl Lagerfeld — by enhancing and developing new designs.
However, management informed that it has closed retail stores and corporate offices, and has been working remotely in view of the coronavirus outbreak. Further, it informed that it has been monitoring developments of the pandemic and its impact on sales, operations and supply chain. Consequently, G-III Apparel has not provided any outlook for fiscal 2021 as of now. Furthermore, the company expects minimal delays in production and transit times, depending on the current updates for factory operations in China and other affected areas. Sales from the retail partners and the company’s retail stores are also facing the brunt.
Q4 in Detail
Adjusted earnings improved 36.4% year over year to 75 cents per share and surpassed the Zacks Consensus Estimate of 68 cents.
G-III Apparel Group, LTD. Price, Consensus and EPS Surprise
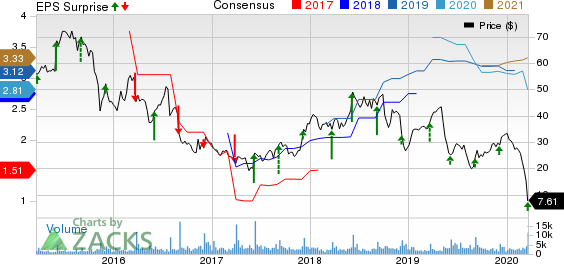
G-III Apparel Group, LTD. price-consensus-eps-surprise-chart | G-III Apparel Group, LTD. Quote
Net sales fell 1.6% year over year to $754.6 million. Moreover, the top line missed the Zacks Consensus Estimate of $792 million, marking the sixth straight quarter of a sales miss. Sales were mainly hurt by warm weather conditions during the holiday season and in January. This weighed on sales of winter apparel, comprising outerwear. Also, decline in sales at the wholesale and retail divisions impacted the overall top line.
Moreover, gross profit declined 3% year over year to $251.1 million. Meanwhile, gross margin of 33.3% contracted 50 basis points (bps), mainly attributable to the lower penetration of the retail segment, partly offset by growth in wholesale unit.
However, SG&A expenses contracted 7.2% year over year to $187.3 million. Further, operating profit plunged 27.3% to $32.3 million in the fiscal fourth quarter, while operating margin contracted 150 bps to 4.3%.
Segmental Performance
Net sales for the Wholesale segment were $635 million, down roughly 1% year over year, mainly hurt by brands in the winter apparel categories. The decline was somewhat offset by growth in the Tommy Hilfiger and DKNY brands.
Net sales at the Retail segment totaled $131 million, down nearly 16% from the prior-year quarter’s reported figure. The segment witnessed sales declines across Wilsons and G.H. Bass, somewhat offset by growth in DKNY. Notably, same-store sales declined nearly 6% at Wilsons and 10% at G.H. Bass, while the metric rose 3% at DKNY stores. A decline in about 26 stores operated by the company also built pressure on the segment’s performance.
Other Financial Details
G-III Apparel ended fourth-quarter fiscal 2020 with cash and cash equivalents of $197.4 million and long-term debt of $397.5 million. Total stockholders’ equity was $1,290.7 million. It spent roughly $38 million as capital expenditures.
At fiscal 2020-end, this Zacks Rank #3 (Hold) company had roughly $600 million under its $650-million revolving credit facility.
3 Better-Ranked Stocks in the Same Space
Cimpress N.V. (NASDAQ:CMPR) has an average positive earnings surprise of 41.4% for the trailing four quarters. Also, it sports a Zacks Rank #1 (Strong Buy). You can see the complete list of today’s Zacks #1 Rank stocks here.
Deckers Outdoor Corporation (NYSE:DECK) , with a Zacks Rank #2 (Buy), has a long-term earnings per share growth rate of 12.4%.
Netflix, Inc. (NASDAQ:NFLX) has a long-term EPS growth rate of 30% and a Zacks Rank of 2.
Today's Best Stocks from Zacks
Would you like to see the updated picks from our best market-beating strategies? From 2017 through 2019, while the S&P 500 gained and impressive +53.6%, five of our strategies returned +65.8%, +97.1%, +118.0%, +175.7% and even +186.7%.
This outperformance has not just been a recent phenomenon. From 2000 – 2019, while the S&P averaged +6.0% per year, our top strategies averaged up to +54.7% per year.
See their latest picks free >>
Deckers Outdoor Corporation (DECK): Free Stock Analysis Report
Netflix, Inc. (NFLX): Free Stock Analysis Report
G-III Apparel Group, LTD. (GIII): Free Stock Analysis Report
Cimpress N.V (CMPR): Free Stock Analysis Report
Original post
Zacks Investment Research