
After the recent buys of Unilever and Nestlé, I want to force the industrial sector in my Dividend Yield Passive Income Portfolio (DYPI). One big player within the sector is General Electric (GE).
General Electric Company operates as a technology and financial services company worldwide. The company's Energy Infrastructure segment offers wind turbines; gas and steam turbines and generators; integrated gasification combined cycle systems; aircraft engine derivatives; nuclear reactors, fuel, and support services; oil and gas extraction and mining motors and control systems; aftermarket services; water treatment solutions; power conversion infrastructure technology and services; and integrated electrical equipment and systems.
GE is a diversified machinery stock with $245 billion market capitalization and sales of $147 billion. The current P/E ratio amounts to 16.83 and the dividend yield is at 3.25 percent. Earnings are expected to grow for the mid-term by a double-digit rate. The forward P/E is 12.71.
I bought 65 shares for a price of 23.39. The total purchase amount was $1,525.35 and will give me around $50 per year in additional dividends. The total portfolio income is now forecasted at $1,131.18 per year.
The average portfolio yield is 3.56 percent and the yield on cost (yield when I bought the stocks) amounts to 3.75 percent). The yield ratio declined because of the small capital gain of 4.87 percent.
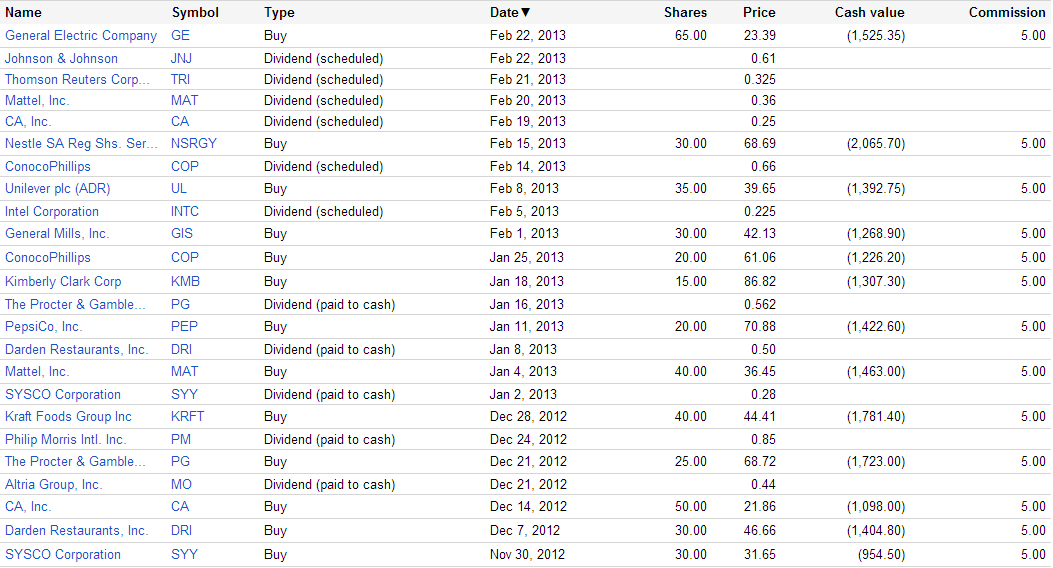
The virtual portfolio has now 21 stock holdings. Combined they have a current market value of $31,428.4. I purchased all stocks for a total cost of $29,968.25. Stocks of the DYPI-Portfolio are up 4.87 since the date of funding – October 04, 2012.
Only 30 percent of the 100k funded asset vehicle is currently invested. Roughly 70 percent or $70,177.80 in cash is still available for further stock acquisitions. With this money, I plan to increase the total number of stocks to 50-70 by the end of this year. With this in mind, the whole dividend income should grow to $3,000 to $4,000 per year. Over the next decade, this amount should double.
The total portfolio performance is 1.61 percent of which 1.56 percent was generated this year. 
GE is a high debt loaded company. The total long-term loans amounted to $414 billion as of Q4/2012 and cash of $125.7 billion was accounted. The company has also a strong cash flow of $33 billion and an EBITDA in a range of $18 billion. So the EV/EBITDA ratio is around 17 - that's a damn high value. But capital business works different. In times of rising financial costs or financial crises, the business model could be hurt.
- English (UK)
- English (India)
- English (Canada)
- English (Australia)
- English (South Africa)
- English (Philippines)
- English (Nigeria)
- Deutsch
- Español (España)
- Español (México)
- Français
- Italiano
- Nederlands
- Português (Portugal)
- Polski
- Português (Brasil)
- Русский
- Türkçe
- العربية
- Ελληνικά
- Svenska
- Suomi
- עברית
- 日本語
- 한국어
- 简体中文
- 繁體中文
- Bahasa Indonesia
- Bahasa Melayu
- ไทย
- Tiếng Việt
- हिंदी
General Electic: The Next Stock Buy
Published 02/25/2013, 01:39 AM
Updated 07/09/2023, 06:31 AM
General Electic: The Next Stock Buy
3rd party Ad. Not an offer or recommendation by Investing.com. See disclosure here or
remove ads
.
Latest comments
Install Our App
Risk Disclosure: Trading in financial instruments and/or cryptocurrencies involves high risks including the risk of losing some, or all, of your investment amount, and may not be suitable for all investors. Prices of cryptocurrencies are extremely volatile and may be affected by external factors such as financial, regulatory or political events. Trading on margin increases the financial risks.
Before deciding to trade in financial instrument or cryptocurrencies you should be fully informed of the risks and costs associated with trading the financial markets, carefully consider your investment objectives, level of experience, and risk appetite, and seek professional advice where needed.
Fusion Media would like to remind you that the data contained in this website is not necessarily real-time nor accurate. The data and prices on the website are not necessarily provided by any market or exchange, but may be provided by market makers, and so prices may not be accurate and may differ from the actual price at any given market, meaning prices are indicative and not appropriate for trading purposes. Fusion Media and any provider of the data contained in this website will not accept liability for any loss or damage as a result of your trading, or your reliance on the information contained within this website.
It is prohibited to use, store, reproduce, display, modify, transmit or distribute the data contained in this website without the explicit prior written permission of Fusion Media and/or the data provider. All intellectual property rights are reserved by the providers and/or the exchange providing the data contained in this website.
Fusion Media may be compensated by the advertisers that appear on the website, based on your interaction with the advertisements or advertisers.
© 2007-2024 - Fusion Media Limited. All Rights Reserved.