After the result of the Brexit referendum in Great Britain, the British pound made the biggest and fastest price drop since its existence. Almost 2000 ticks in one single trading day.
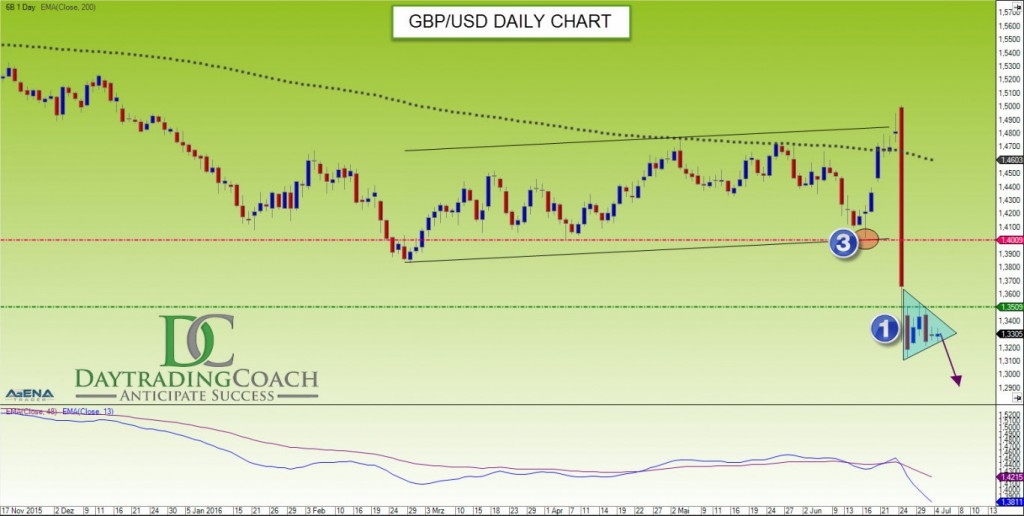
And this, just after the British national currency had been moving cleanly in an upward trend channel the months prior. On the Thursday before the referendum, the pound was even able to briefly break upwards out of the channel, thereby also climbing above the 200 EMA.
But this false breakout was dispelled directly in the opposite direction on Friday. Now, after the strong downward movement, a typical correction pattern – a triangle – has formed (no. 1 in figure 1 below).
Normally, the price exits these triangles in the direction of the last momentum. And this momentum was very clearly downwards. I would be very surprised, therefore, if the slide in price does not continue on considerably further downwards after leaving the triangle.
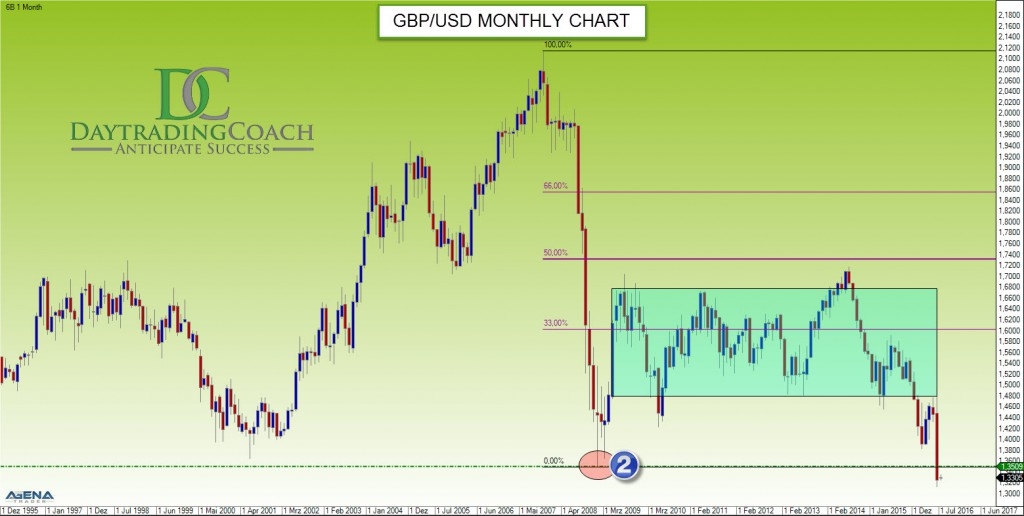
All important levels have already been tested in the triangle correction. In figure 1, you can easily see that the correction ran down pretty precisely to 1.35 (green line on the chart). That was the last significant low on the monthly chart from January 2009 (no. 2 in figure 2 below).
In downward movements, the old significant lows of the past are often tested from below. The price then gets stuck at these areas of resistance, to then run on in the old trend direction once again.
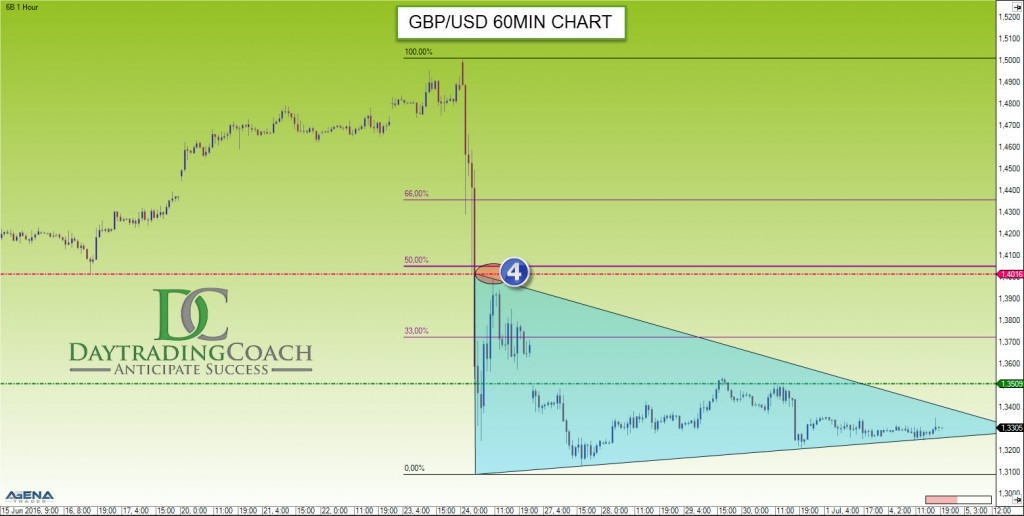
And in just this manner, the last significant low from the daily chart before the Brexit referendum (no. 3) was tested right at about 1.40. Although this cannot be seen on the daily chart, when you switch to the 60-min chart, it becomes clear that the 1.40 was already tested on Friday during the day (no. 4).
The resistance area 1.40 was also particularly strong, because there it was almost exactly in the region of the 50% retracement of the large downward movement.
A breakout downwards out of the triangle, therefore, opens the way for a further price decline of the cable. A price target on the lower side is hard to determine, since the price has not been as low as it is now for the last 30 years.
If one uses the classic projection of the triangle as an aid, then using the “small” triangle, one gets the price target 1.28 on the daily chart. The “large” triangle from the 60-min chart even delivers, by means of projection of the height of the triangle at the breakout, a price target of 1.23.
However, caution is advised in the current politically tense situation. Politically extreme situations can quickly cancel out the chart technique and cause a fast change of direction. So: remember your stops. No trade without a stop!
Disclaimer: Exchange transactions are associated with significant risks. Those who trade on the financial and commodity markets must familiarize themselves with these risks. Possible analyses, techniques and methods presented here are not an invitation to trade on the financial and commodity markets. They serve only for illustration, further education, and information purposes, and do not constitute investment advice or personal recommendations in any way. They are intended only to facilitate the customer’s investment decision, and do not replace the advice of an investor or specific investment advice. The customer trades completely at his or her own risk.


