GBP/USD: Today's Technical Report/Commentary:
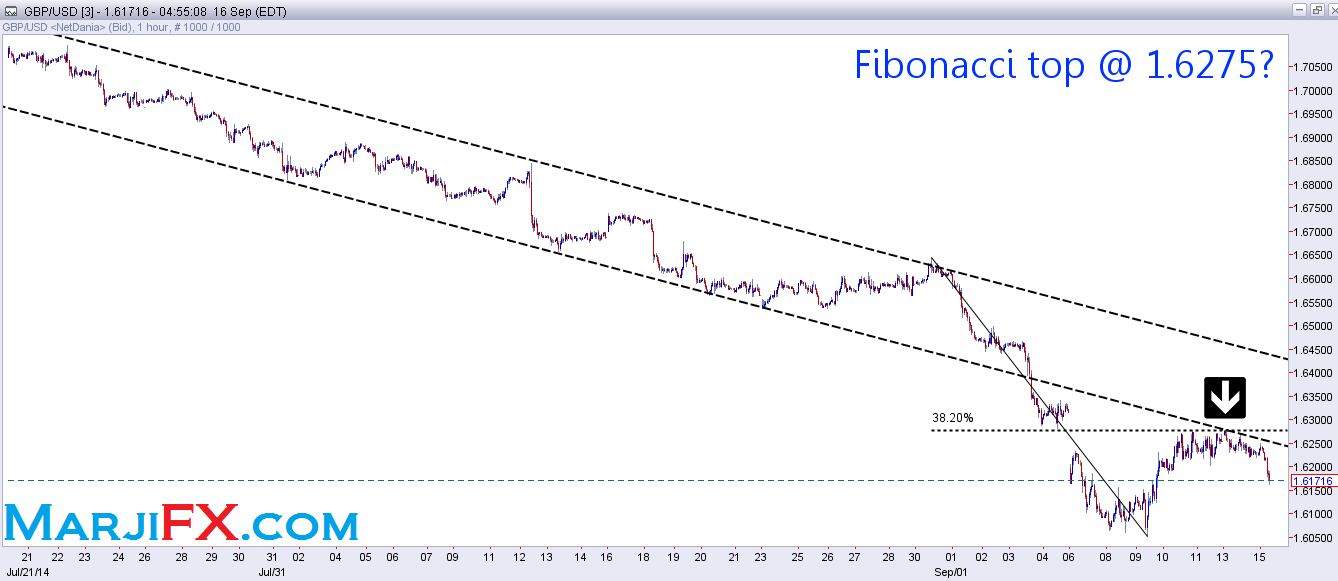
The matter of the hour for the Cable, technically, is to determine if topping last week at 1.6275 constitutes a Fibonacci top. As you may remember, the recovery faced problems late last week topping extremely close to the short term Fibonacci 38.2% level at 1.6275. A look at the attached chart illustrates that this level is also very close to the bottom of the previous falling trend channel. This is why the Pound dropped back below $1.62.
If this is actually a Fibonacci top, what does that imply? Topping accurately at Fibonacci or Marji retracement levels, is usually a good sign of a correction ending, and this means that the recovery from 1.6050 might be merely a short term correction that has ran out of steam, and that it is time to break below the bottom from which this correction has started: 1.6050.
This prediction will gain more confidence once we break below 1.6163. This is the Fibonacci 50% for the micro term, and since the daily low is only 2 pips below it, then a break below it is needed to prevent the bulls from using is as a cushion to recover again. A break below this level will target 1.6114. A break below 1.6114 would confirm that the price is targeting a test of 1.6001.
On the other hand, if the Pound is to continue recovering from 1.6050 it must break above 1.6276, the sooner the better. But after the drop seen this morning, first resistance has been shifted lower to 1.6231. As long as the price is trading below 1.6231, the bears do not need to worry about testing/breaking 1.6276.
However, If 1.6276 gives way, the rising correction from 1.6050 will continue. First target for this break would be 1.6327, which will fill the gap seen last week. Above here we have the rest of the short term Fibonacci retracements at 1.6346, 1.6416 & 1.6473. A break above the latter is unlikely for now, but in case it actually happens, the first target for such an important break would be 1.6620.
Aside from the technical, the Pound’s great event this week is the Scottish independence referendum, which is due this Thursday. This event is expected to influence trading the Pound all through this week. Caution is advised.
Support:
• 1.6163: micro term Fibonacci 50% retracement calculated for the rising move from September 10th 10-month low 1.6050 to Friday’s daily high & probable Fibonacci top 1.6275. This level was tested earlier today, when the price reached a daily low only 2 pips below it.
• 1.6136: micro term Fibonacci 61.8% retracement calculated for the rising move from September 10th 10-month low 1.6050 to Friday’s daily high & probable Fibonacci top 1.6275.
• 1.6114: micro term Fibonacci 71.4% retracement calculated for the rising move from September 10th 10-month low 1.6050 to Friday’s daily high & probable Fibonacci top 1.6275.
• 1.6050: September 10th 10-month low.
• 1.6001: long term Fibonacci 50% calculated for whole enormous move from 2013 yearly low 1.4812 to July’s 6-year high 1.7190.
• 1.5954: September 23rd 2013 daily low & short term bottom.
• 1.5902/21: a well-known support area which includes several daily lows from October & November 2013.
Resistance:
• 1.6231: the falling trend line from Friday's high.
• 1.6276: short term Fibonacci 38.2% retracement level, calculated for the drop from September 1st daily high 1.6642 to September 10th 10-month low 1.6050. This level was tested on Friday with stunning accuracy, when the price topped at a 1-week high one single pip below it!
• 1.6327: Friday September 5th closing price, which is the beginning point of the gap seen last week.
• 1.6346: short term Fibonacci 50% retracement level, calculated for the drop from September 1st daily high 1.6642 to September 10th 10-month low 1.6050.
• 1.6388: short term Marji 57.1% retracement level, calculated for the drop from September 1st daily high 1.6642 to September 10th 10-month low 1.6050.
• 1.6416: short term Fibonacci 61.8% retracement level, calculated for the drop from September 1st daily high 1.6642 to September 10th 10-month low 1.6050.
• 1.6473: short term Marji 71.4% retracement level, calculated for the drop from September 1st daily high 1.6642 to September 10th 10-month low 1.6050.
• 1.6485: medium term Fibonacci 38.2% retracement level, calculated for the whole move from July’s 6-year high 1.7190 to September 10th 10-month low 1.6050.
• 1.6620: medium term Fibonacci 50% retracement level, calculated for the whole move from July’s 6-year high 1.7190 to September 10th 10-month low 1.6050.
Trend:
• Short term: Down, as long as we are below 1.6276.
• Medium term: Down, as long as we are below 1.6473.
• Long term: Up, as long as we are above 1.5492.
Article originally appeared on MarjiFX.com
