GBP/USD
The GBP/USD has started this week very strongly continuing to move higher and getting within reach of 1.6450. In the middle of last week it did well to break through the long term resistance level at 1.6250, which had established itself as a level of significance over the last few months. Over the last few weeks or so the pound has bounced strongly off the support level at 1.59 to return back to its present levels. Towards the end of October the GBP/USD slowly drifted lower from the strong resistance level at 1.6250 and down to a three week low just around 1.5900 which was recently passed as the pound moved down towards 1.5850 only a week ago. For the week or so before that the pound moved well from the key level at 1.60 back up to the significant level at 1.6250, only again for this level to stand tall and fend off buyers for several days. Throughout September the pound rallied well and surged higher to move back up strongly through numerous levels which was punctuated by a push through to its highest level for the year just above 1.6250 several weeks ago. In the first week of October the pound was easing back towards 1.60 and 1.59 where it established a narrow trading range between before surging back to 1.6250 again.
Back in the middle of August the pound surged higher to through the resistance level at 1.56 to a then two month high around 1.5650, before spending the next few days consolidating and trading within a narrow range around 1.5650, receiving support from the key 1.56 level. A couple of months ago the resistance level at 1.54 was proving to be quite solid, and once it broke through the pound surged higher to a new seven week high near 1.56 in a solid 48 hour period run. In the week leading up to this the pound had recovered strongly and returned to the previous resistance level at 1.54 after the week earlier undoing some of its good work and falling away sharply from the resistance level at 1.54 back down to around 1.5150 and a two week low. A few weeks ago the 1.54 resistance level stood firm and the pound fell away heavily, however the 1.51 support level proved decisive and helped the pound rally strongly.
Earlier in July after having done very little for about a week, the GBP/USD started to move and surge higher and move through the 1.52 and 1.53 levels to the one month high above 1.54. Prior to the move higher, it moved very little as it found solid support at 1.51 and traded within a narrow range above this level. It established a trading range in between 1.51 and 1.52 after it took a breather from its excitement just prior when it experienced a strong surge higher moving back to within reach of the 1.52 level from below 1.49, all in 24 hours. About a month ago it did well to climb off the canvas and move back above 1.49 and towards 1.50 again before seeing the pound reverse and head back down below 1.49 to reach a new multi-year low near 1.48. It experienced sharp falls moving from 1.53 down to the key long term level of 1.50 and then through 1.49. That movement saw it resume its already well established medium term down trend from the second half of June and move it to a four month low.
The BoE is being prudent and is following in the footsteps of global regulators. Like all good Central Banks, the "Old Lady" is trying to stay ahead of the curve and be proactive, and not be held responsible for a return to reckless housing lending. No one wants to be the architect of another potential bubble. Yesterday, the BoE announced that they have fine-tuned its funding for lending scheme (FLS) – shifting their focus to the SME sector rather than on residential lending for next year. Carney said it would, "no longer be appropriate or necessary for us to have our foot on the accelerator" in terms of spurring mortgage lending. "It's better to shift into neutral." The sense is that by taking such action it can actually limit the need for direct monetary policy tightening. GBP/USD Daily Chart" title="GBP/USD Daily Chart" width="551" height="232">
 GBP/USD 4 Hourly Chart" title="GBP/USD 4 Hourly Chart" width="551" height="232">
GBP/USD December 2 at 02:10 GMT 1.6434 H: 1.6443 L: 1.6367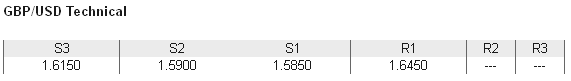 GBP/USD Technical Chart" title="GBP/USD Technical Chart" width="551" height="232">
During the early hours of the Asian trading session on Monday, the GBP/USD is taking no prisoners and is continuing to move strongly higher to new multi year highs. To start this year the pound fell very strongly from near 1.64 down to below 1.50 however the second half of the year has seen it recover strongly and move beyond 1.64 to new highs. Current range: Above 1.64 around 1.6430.
Further levels in both directions:
• Below: 1.6150, 1.5900 and 1.5850.
• Above: 1.6450. GBP/USD Position Ratio Chart" title="GBP/USD Position Ratio Chart" width="551" height="232">
(Shows the ratio of long vs. short positions held for the GBP/USD among all OANDA clients. The left percentage (blue) shows long positions; the right percentage (orange) shows short positions.)
The GBP/USD long positions ratio has moved back well below 30% as the GBP/USD continues to push higher strongly. Trader sentiment remains heavily in favour of short positions.
Economic Releases
- 22:30 (Sun) AU AIG Manufacturing PMI (Nov)
- 23:30 (Sun) AU TD-MI Inflation Gauge (Nov)
- 23:50 (Sun) JP Capital Spending (Q3)
- 00:30 AU Inventories (Q3)
- 00:30 AU Building approvals (Oct)
- 05:00 JP Vehicle Sales (Nov)
- 08:00 UK Halifax House Price Index (2nd-6th) (Nov)
- 08:58 EU Manufacturing PMI (Nov)
- 09:28 UK CIPS/Markit Manufacturing PMI (Nov)
- 13:58 US Manufacturing PMI (Nov)
- 15:00 US Construction Spending (Sep & Oct)
- 15:00 US ISM Manufacturing (Nov)