Talking Points- GBP/USD breaks through trendline from October 2013, February 2014 lows.
- Low volatility portends to ranges; will respect recent pivot near 1.6730.
- Forex economic calendar littered with US event risk next few days.
The British Pound has been one of the strongest major currencies year-to-date, but evidence is building to suggest that a near-term top may be forming. Although volatility conditions remain dampened – the GBP/USD 10-day ATR is only 65.8-pips – we would be remiss to ignore the shifting fundamental conditions alongside growing potential for a short-term technical flush.
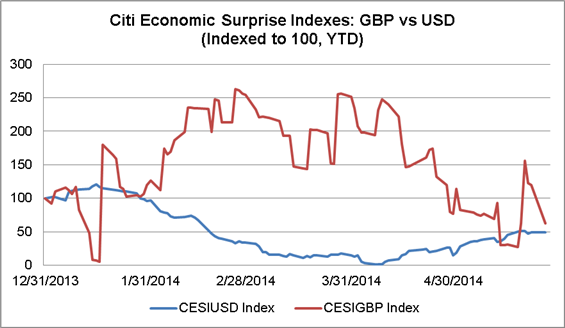
One of the primary, if not the primary reason, for GBP/USD strength this year has been the dramatic divergence between UK and US economic data. Using the Citi Economic Surprise Index as a proxy for economic data momentum, British data over the course of 2014 thus far has been mostly positive, while American data over the same stretch has baffled economists and traders alike – which can be cited as a reason why the 10-year US Treasury note yield is struggling around 2.500%.
In recent weeks, economic data momentum has shifted in favor of a weaker GBP/USD. Measuring economic data momentum indexed to 100 at the start of 2014, the GBP CESI has plunged to 62.2 from 156.11 just one week ago. The USD CESI, indexed to 100, has recovered from its yearly lows in April to 49.34 today. Taking a look at the data raw, the GBP CESI is at -0.90 while the USD CESI is at +2.00. There has been a substantive shift in the fundamental dynamic underpinning GBP/USD.

The convergence in data momentum has aided GBP/USD in pulling back over the past week and as a result, a significant short-term support level could be tested over the coming days. Before we look at a short-term chart, let’s consider a longer-term perspective on the GBP/USD daily chart:
Forex Technical Analysis: GBP/USD Chart (Daily)

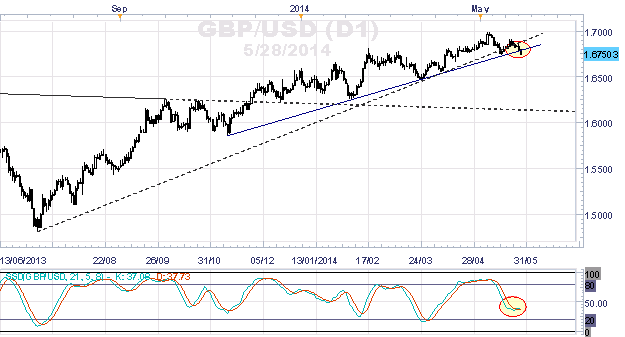
- Price has fallen through the rising trendline from the July 2013 and April 2014 lows near $1.6850.
- A more recent trendline, from the October 2013 and February 2014 lows, has also broken today, near $1.6780.
- Yesterday’s price action took the form of a daily bearish outside bar, suggesting that selling interest has been elevated in recent days. A bearish bias is appropriate against the high at $1.6885.
- The Slow Stochastic oscillator has flipped to a sell signal today.
Forex Technical Analysis: GBP/USD Chart (H4)

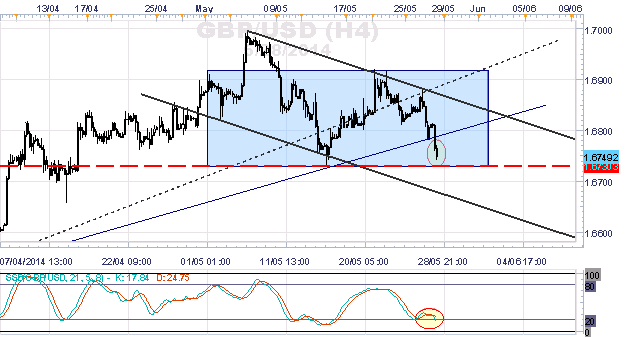
- The H4 timeframe offers a clearer view of the levels currently being tested, the pivot low on May 15 at $1.6730.
- The low volatility conditions cater better to range trading strategies, and in context of the Slow Stochastic oscillator on the H4 timeframe at the same oversold levels that produced a rebound on May 15, we are not inclined to engage the bearish momentum on the daily timeframe unless there is a close through $1.6730.
- Range trading strategies may be appropriate in the near-term as long as $1.6730 holds.
--- Written by Christopher Vecchio, Currency Analyst
