Get 40% Off
👀 👁 🧿 All eyes on Biogen, up +4,56% after posting earnings. Our AI picked it in March 2024.
Which stocks will surge next?
Unlock AI-picked Stocks

GBP/USD, EUR/USD: Revisiting Long-Term Charts

Published 08/22/2014, 05:18 AM
Updated 07/09/2023, 06:31 AM

As the USD begins to strengthen across the G10 board, CitiFX Technicals update some of the long-term charts for GBP/USD, and EUR/USD.

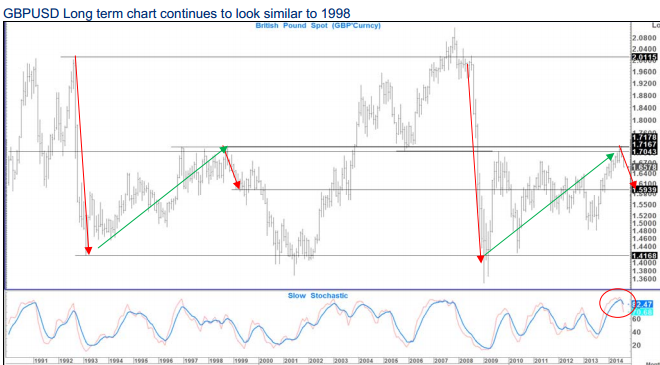
In GBP/USD, Citi notes that the overall price action is still very similar to that seen throughout the 1990’s

"Recently we have turned from 1.7192…similar to the turn seen in 1998 from a high of 1.7178. What happened next was a fall to 1.5939 over 4 months before consolidating (and then we went lower still)," Citi clarifies.

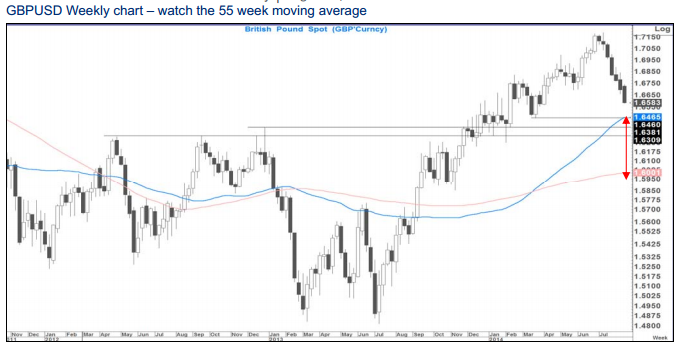
"That is interesting because it is more or less where the 200 week moving average now comes in. A breach of the 55 week moving average at 1.6465 on a weekly closing basis would need to be seen before confirming the next bearish break," Citi argues.

GBP/USD: Long Term

On the weekly chats, Citi notes that GBP/USD continues lower and is likely to test the 55 week moving average and horizontal support levels at 1.6460-65.

"A weekly close below there may well open the way for a move to the 200 week moving average at 1.60 with interim support levels at 1.6381 and 1.6309. Given the general strength of the USD and Carney’s ongoing “U” turns, we would not be surprised to see the downtrend continue here," Citi adds.

GBP/USD: Weekly

In EUR/USD, Citi notes that it has breached the base of the recent range and the support level at 1.3295.

"The next support is at 1.3105 (Sept. 2013 low)," Citi notes.

"The two important lows from last year at 1.2745 and 1.2755 (the levels from where we set a platform for a decent rally) are likely to be tested over the coming months, probably by year end," Citi projects.

3rd party Ad. Not an offer or recommendation by Investing.com. See disclosure here or remove ads .

In line with this view, Citi maintains a short EUR/USD position as a long-term trade from 1.3731, targeting a move to 1.2750.

Original post

Latest comments

Risk Disclosure: Trading in financial instruments and/or cryptocurrencies involves high risks including the risk of losing some, or all, of your investment amount, and may not be suitable for all investors. Prices of cryptocurrencies are extremely volatile and may be affected by external factors such as financial, regulatory or political events. Trading on margin increases the financial risks.
Before deciding to trade in financial instrument or cryptocurrencies you should be fully informed of the risks and costs associated with trading the financial markets, carefully consider your investment objectives, level of experience, and risk appetite, and seek professional advice where needed.
Fusion Media would like to remind you that the data contained in this website is not necessarily real-time nor accurate. The data and prices on the website are not necessarily provided by any market or exchange, but may be provided by market makers, and so prices may not be accurate and may differ from the actual price at any given market, meaning prices are indicative and not appropriate for trading purposes. Fusion Media and any provider of the data contained in this website will not accept liability for any loss or damage as a result of your trading, or your reliance on the information contained within this website.
It is prohibited to use, store, reproduce, display, modify, transmit or distribute the data contained in this website without the explicit prior written permission of Fusion Media and/or the data provider. All intellectual property rights are reserved by the providers and/or the exchange providing the data contained in this website.
Fusion Media may be compensated by the advertisers that appear on the website, based on your interaction with the advertisements or advertisers.
© 2007-2024 - Fusion Media Limited. All Rights Reserved.