Get 40% Off
🤯 Perficient is up a mind-blowing 53%. Our ProPicks AI saw the buying opportunity in March.Read full update

FXI Slowly Completes Big Top Before Plunge

Published 04/06/2015, 12:36 AM
Updated 07/09/2023, 06:31 AM

iShares China Large Cap Chart

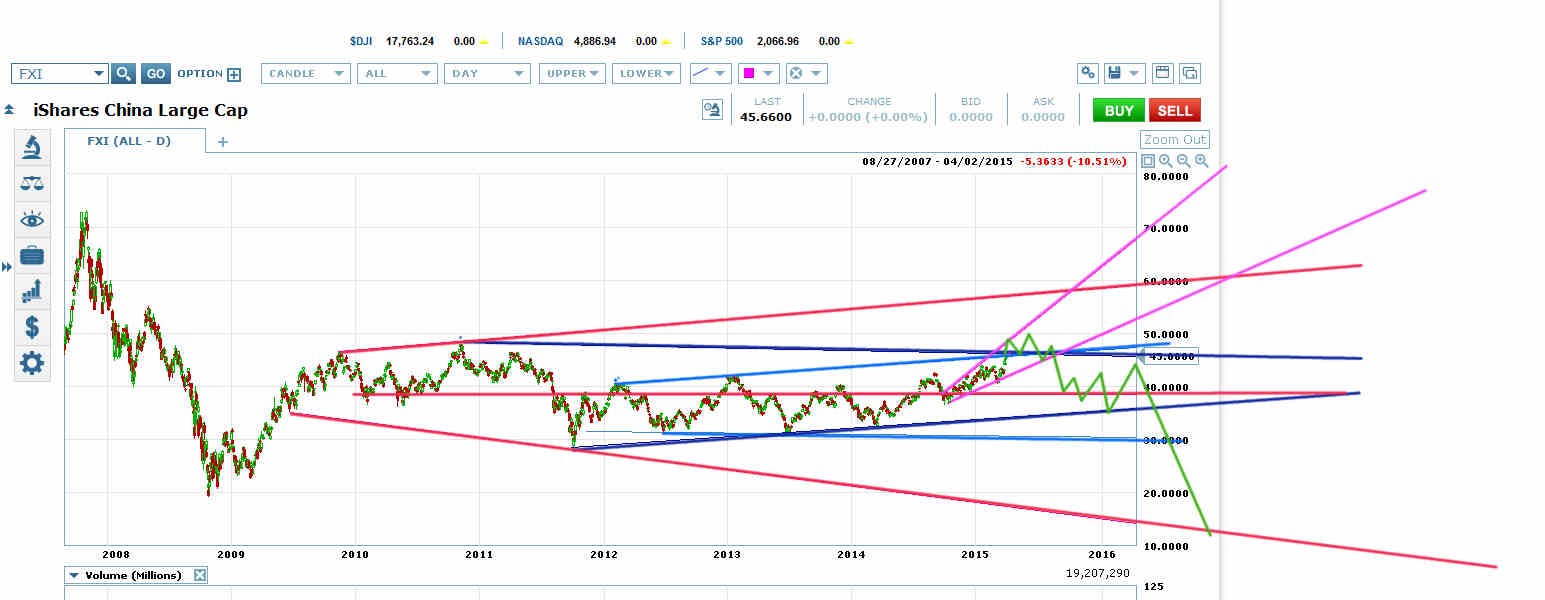
iShares FTSE/Xinhua China 25 Index (ARCA:FXI) put in a pretty straightforward crash from late 2007 to its late 2008 low. Then it put in a fast, steep rally in 2009, and it’s been topping for another plunge ever since.

The topping pattern is a megaphone (red on chart) in which interior megaphones have been forming across VWAP of the larger megaphone. When you see megaphones forming across the VWAP of larger megaphones, you know a triangle is forming (navy blue on chart).

FXI has just put in a 5th wave melt-up (with a rising megaphone top) with the latest of these interior VWAP megaphones (bright blue on chart). It reached the top of this interior megaphone last week. It should put in a little top up here then plunge back down to VWAP at roughly 38.50 and start a new megaphone there that will complete the navy blue triangle.

Then the entire mess should break out downwards to roughly the bottom of the red megaphone. That wave down should be a crash.

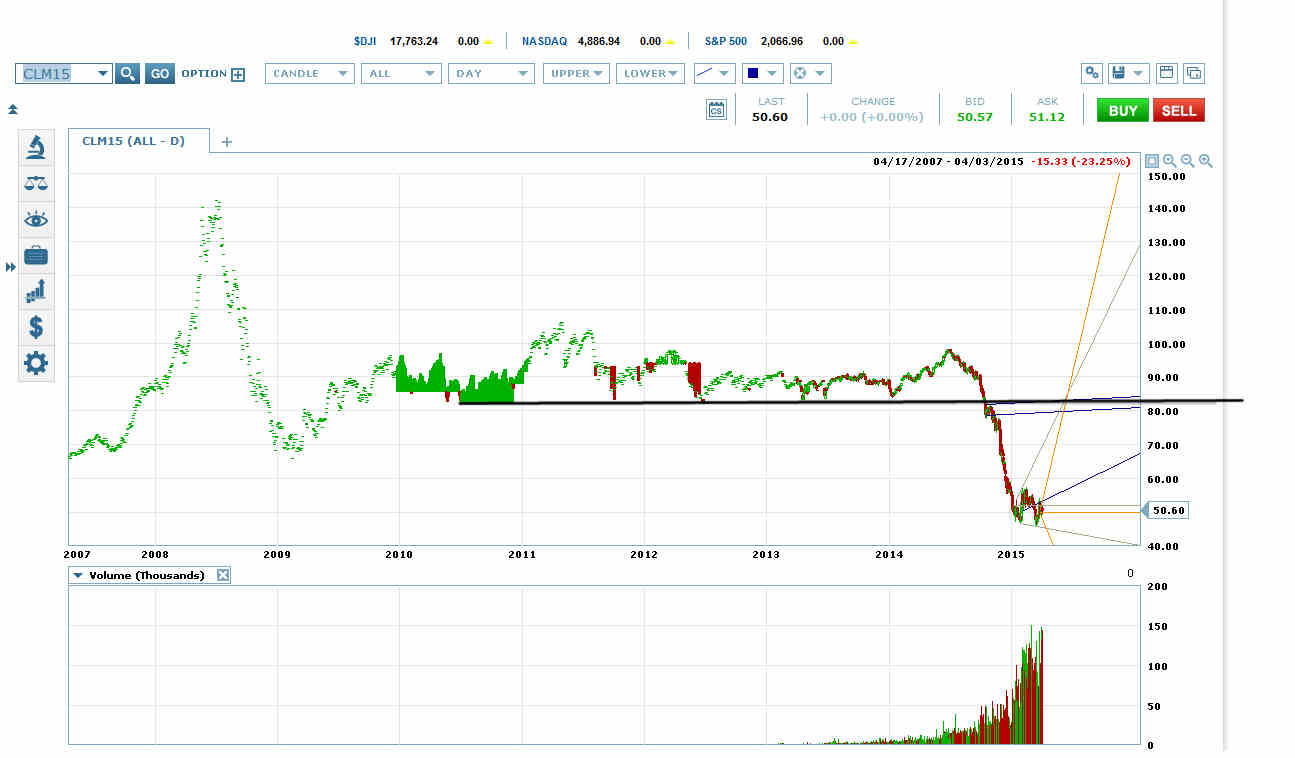
What FXI is doing on its long-term chart is a very common crash and post-crash pattern. For example, we saw the same pattern in oil, except the top of the rally wave was an extended head and shoulders pattern instead of a triangle.
QQQ Chart

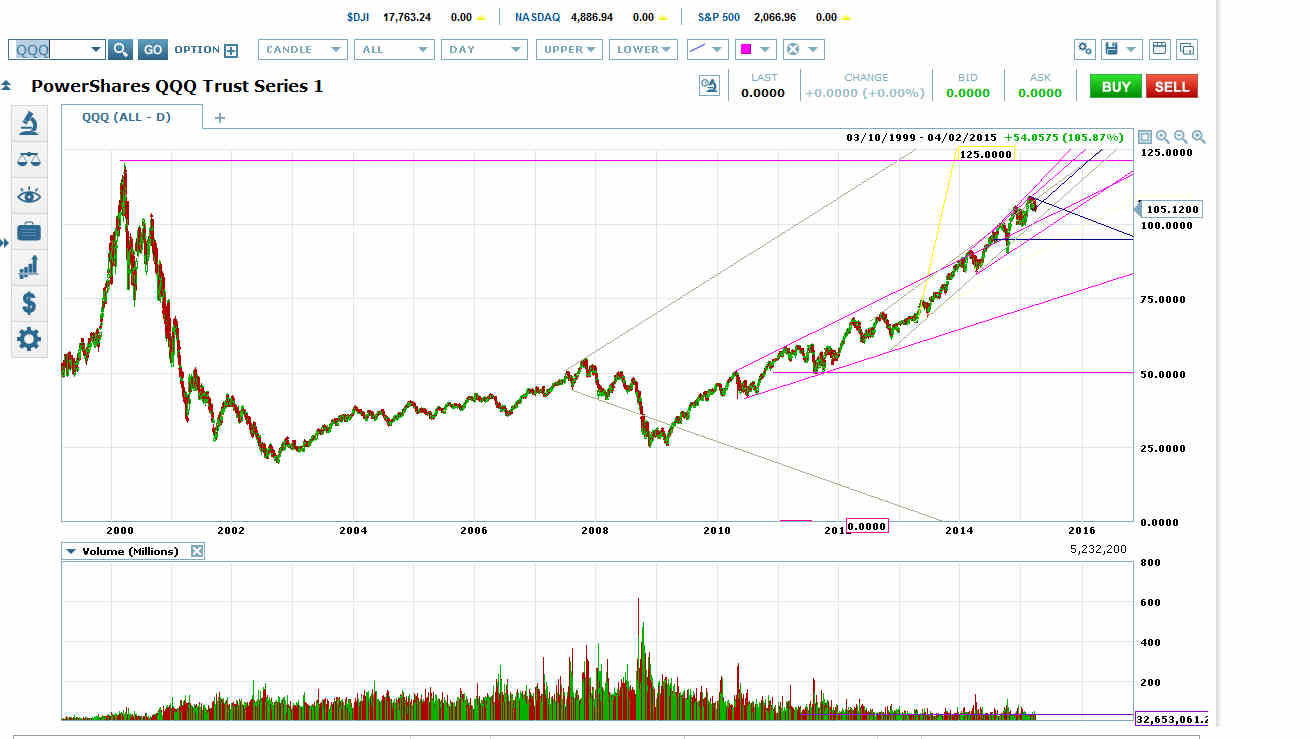
And we saw this pattern in PowerShares QQQ (NASDAQ:QQQ) after the dot-com crash, although in this case the rally took longer and the megaphone top formed a lot faster.

You see this pattern on all time frames.
QQQ Chart II

3rd party Ad. Not an offer or recommendation by Investing.com. See disclosure here or remove ads .

The QQQ chart gives you a good idea of what happens in this pattern after the retest of the crash low.

Original post

Latest comments

Risk Disclosure: Trading in financial instruments and/or cryptocurrencies involves high risks including the risk of losing some, or all, of your investment amount, and may not be suitable for all investors. Prices of cryptocurrencies are extremely volatile and may be affected by external factors such as financial, regulatory or political events. Trading on margin increases the financial risks.
Before deciding to trade in financial instrument or cryptocurrencies you should be fully informed of the risks and costs associated with trading the financial markets, carefully consider your investment objectives, level of experience, and risk appetite, and seek professional advice where needed.
Fusion Media would like to remind you that the data contained in this website is not necessarily real-time nor accurate. The data and prices on the website are not necessarily provided by any market or exchange, but may be provided by market makers, and so prices may not be accurate and may differ from the actual price at any given market, meaning prices are indicative and not appropriate for trading purposes. Fusion Media and any provider of the data contained in this website will not accept liability for any loss or damage as a result of your trading, or your reliance on the information contained within this website.
It is prohibited to use, store, reproduce, display, modify, transmit or distribute the data contained in this website without the explicit prior written permission of Fusion Media and/or the data provider. All intellectual property rights are reserved by the providers and/or the exchange providing the data contained in this website.
Fusion Media may be compensated by the advertisers that appear on the website, based on your interaction with the advertisements or advertisers.
© 2007-2024 - Fusion Media Limited. All Rights Reserved.