- Gold up USD 40 in a day
- USDJPY still trading near support
- Lack of activity belies world events
- New Zealand Jun. ANZ Consumer Confidence out at 131.9 vs. 127.6 in May
- Euro Zone Apr. Current Account (0800)
- Euro Zone ECB’s Mersch to Speak (0815)
- Poland National Bank of Poland releases meeting minutes (1200)
- Canada Apr. Retail Sales (1230)
- Canada May CPI (1230)
- Japan Jun. Preliminary Markit/JMMA Manufacturing PMI (Mon 0135)
- China Jun. Preliminary HSBC Manufacturing PMI (Mon 0145)
The post FOMC reaction has so far been generally underwhelming in currency markets, in line with the underwhelming move in how the market now anticipates the Federal Reserve Bank will move on interest rates. The June 2015 Fed Funds future, for example, is merely approximately back to where it closed last week and two-year rates are all of 3 basis points lower than their highest daily close earlier this week.
Elsewhere, however, the reactions have been more enthusiastic, as US equities scratched back to all-time highs yesterday and precious metals launched a spectacular squeeze yesterday – taking gold up over USD40 in a single day and well through all local resistance levels. Geopolitics, the argument that the Fed may be behind the curve on inflation and stresses in the Chinese collateral-financing market, may be the contributors there.
Levels
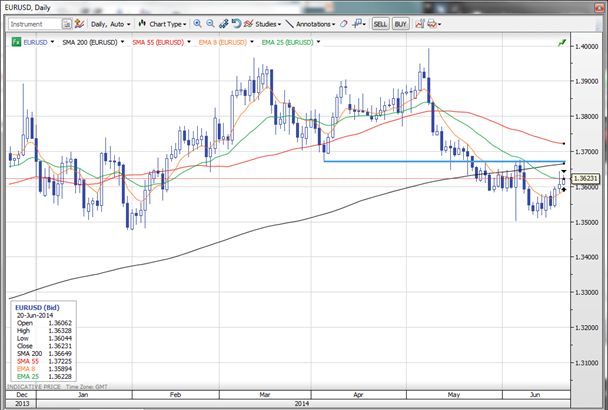
EURUSD – The 1.3670 area is the 200-day moving average just ahead of the flat-line resistance zone. Bears would prefer to not see these levels taken out on the weekly close. It’s all about where bears feel comfortable getting involved – here or slightly higher?
Chart: EURUSD
With US rates at the front end of the curve not shifting much, the bears can reasonably get involved anywhere below the 200-day moving average and key flat-line levels around 1.3670/85, but will need to exercise caution or watch for reversal patterns if this area is broken on a daily close today or early next week.
USDJPY – 101.65 is the 200-day moving average, a technical measure that has been critical on multiple occasions. Below that it is all about the 100.75 area. The action looks heavy, but then again, the range has held for months. As I have said many times recently, it is remarkable that we are trading near support in USDJPY given the market circumstances (complacency, strong risk appetite).
GBPUSD – 1.7000 is support now that it has broken – looking overextended soon, though it has room to extend to about 1.7100 within the current rising channel. The support for further upside is not supported from a UK/US interest rate spread perspective, so I am getting a bit contrarian here unless that spread widens again.
AUDUSD – the 0.9440/60 zone is the upside resistance and range top. Would be happy to get bearish again on a sell-off back through 0.9350. Until then, watching and waiting for how it trades if the resistance line is broken today or early next week.
EURNOK - Yesterday’s Norges Bank meeting was a shocker for the ages, as EURNOK spiked all the way through 8.3000 on the bank’s sudden pivot to dovishness after previously upgrading its rate path forecast. Governor Olsen said that the next move could be a rate cut if the GDP outlook worsens. Clearly, the bank is concerned about the long-term competitiveness of the Norwegian economy (wage levels and cost of living are off the charts on PPP basis) and is willing to tolerate potentially uncomfortably high inflation to prevent NOK from strengthening and to perhaps enhance investment. This guidance may keep NOK on the offer back toward EURNOK of 8.50 .
Looking ahead
USDCAD will be in focus on today’s April Retail Sales and May CPI releases. The pair is looking for something to react to as it remains pinned down on range support, with the 200-day moving average a bit lower below 1.0800. If this zone can’t hold, the last gasp argument for the secular bulls is the major structural support in the 1.0600/25 area.
This is perhaps the most remarkable market environment I can recall since the global financial crisis struck in 2008 – if for the opposite reason. Today’s complacency is as extreme as the volatility of the summer of 2008. And the odd thing is that everyone is throwing up their arms and gesticulating and fretting the current complacency – lots of fear expressed in words, but not in the marketplace. And this is happening as some of the worst geopolitical confrontations could risk spreading further into financial markets – particularly the risk to global crude supplies from a further disruption of supplies in Iraq.
On that note – stay very careful out there.
Economic Data Highlights
Upcoming Economic Calendar Highlights (all times GMT)
