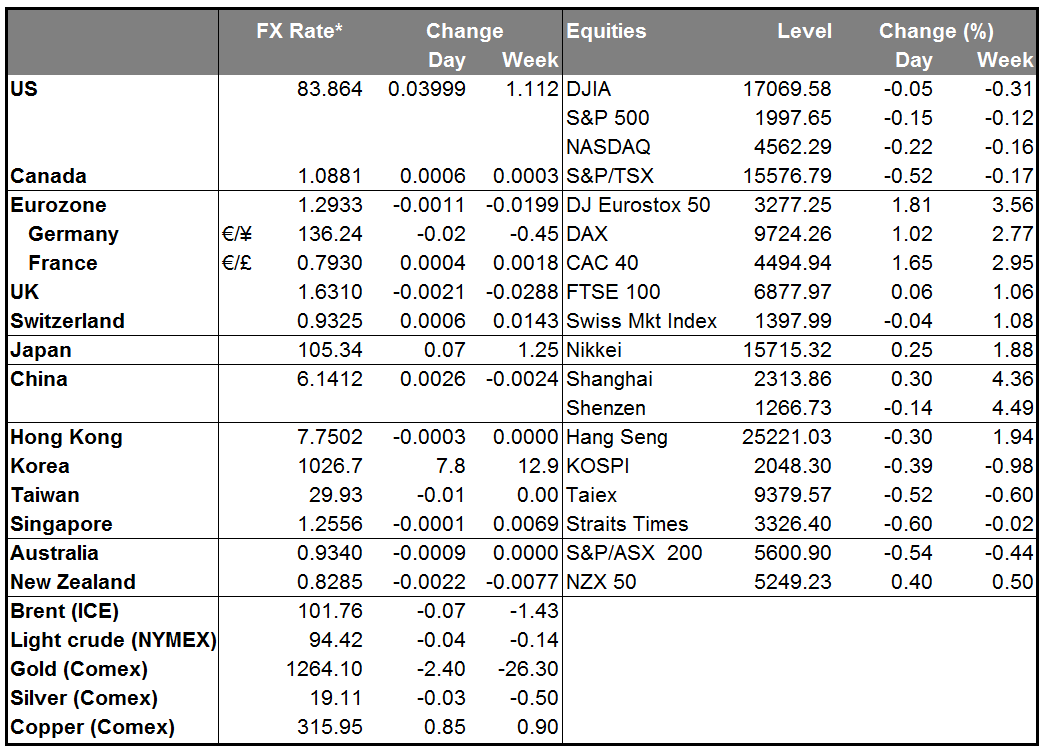
The European Central Bank surprisingly cut all its interest rates by 10bps and announced that the governing council decided to start purchasing non-financial private sector assets. The two new programs announced, include purchasing of asset-backed securities (ABS) and a broad portfolio of euro-denominated covered bonds. Interventions under these programs will be launched next month in an attempt to prevent stagnation and has taken into account the overall subdued outlook for inflation. At the press conference after the rate decision, President Draghi said that the decisions to cut interest rates and announce an ABS programme was not unanimous and he also added that “today’s rate cuts are the last ones”. The ECB has also cut its growth forecasts for this year and next year by 0.1 percentage point each. It now expects the bloc’s growth of 0.9% this year and 1.6% next.
With these moves, the ECB has clearly shown its concern about the economic situation, but we worry that it may be “too little, too late.” ECB data shows that a similar cut in rates in June did have a sizeable impact on borrowing costs for small and medium sized enterprises: rates for SMEs dropped by 25bp in Germany, 15bp in Italy and France and a whopping 40bp in Spain. So yesterday’s rate cut is likely to help further.
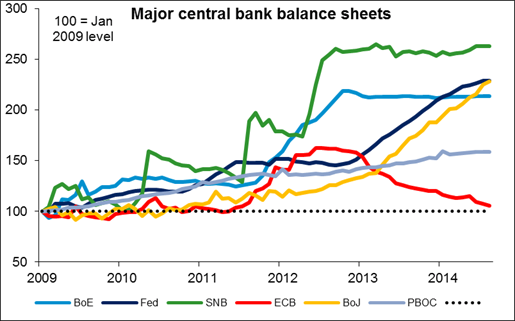
But with rates now up against the zero bound, the ECB only has quantitative easing to fall back for the next step, but that’s difficult in the EU because of the lack of a Europe-wide sovereign bond. Adding the covered bond market to the widely discussed ABS market shows that they are quite serious about this, but they have a long way to go. The ECB’s balance sheet has actually shrunk by about EUR 1tn or 35% since peaking in mid-2012. Over that time, the Fed’s balance sheet expanded by USD 1.5tn or 54% and the Bank of Japan by JPY 129tn or 90%. The ECB’s balance sheet is now the smallest of the major central banks in terms of percent of GDP. Given the limited size of the debt markets in the Eurozone, it will be difficult if not impossible for the ECB to catch up with these other central banks’ efforts. Draghi suggests that the ECB did discuss sovereign bond purchases and that some Council members were in favor of them, but it’s clearly a last-ditch effort because of the legal problems involved. They will want to save that for last.
Moreover, there are clear signs that the ECB Council itself is reaching the limits of what it’s willing to do. Draghi said the decision was not unanimous but was “comfortable,” indicating that there was sizeable opposition. In that case, the hurdle for sovereign bond purchases is likely to be high.
In any case, the implications for the FX market are clear. Draghi himself said that the euro was likely to depreciate against the dollar because of the divergence of monetary policy in the Eurozone and the US. That divergence is now clear as day. The ECB is embarking on new extreme measures to loosen policy at the same time as the FOMC is debating the timing of the first rate hike. I agree with Draghi that EUR/USD is likely to fall further.
The Bank of England on the other hand, left its interest rates on hold as was widely expected. The minutes of the meeting should make for interesting reading when released on Sept. 17, especially after two of the nine MPC members dissenting votes at last month’s meeting.
Today’s events: The main event today will be the US nonfarm payrolls for August. The market consensus is for payrolls to rise by 230k vs 209k in July. If the forecast is met, this will be the seventh straight reading above the 200k level. A strong NFP reading, along with an anticipated decline to a near six-year low unemployment rate of 6.1%, should add to the recent solid US data and boost USD further. Average hourly earnings for August are anticipated to accelerate 2.1% yoy from 2.0% yoy last month. Given the forecast of 2.0% yoy CPI rate for August, this would rise real wages by 0.1% yoy, adding to the positive employment figures.
During the European day, we get industrial production figures for July from Germany, Sweden and Norway. German and Sweden’s figures are expected to accelerate a bit, while no forecast is available from Norway. Eurozone’s final Q2 GDP is coming out and the forecast is for the pace to drop to 0.0% qoq, unchanged from the preliminary reading.
Canada’s unemployment rate for August is expected to remain at 7.0%, while the net change in employment is forecast to decrease to 10.0k from 41.7k.
We have one speaker on Friday’s agenda, Boston Fed President Eric Rosengren speaks at the annual Bankers associations’ conference.
The Market
EUR/USD collapses after the ECB cuts rates
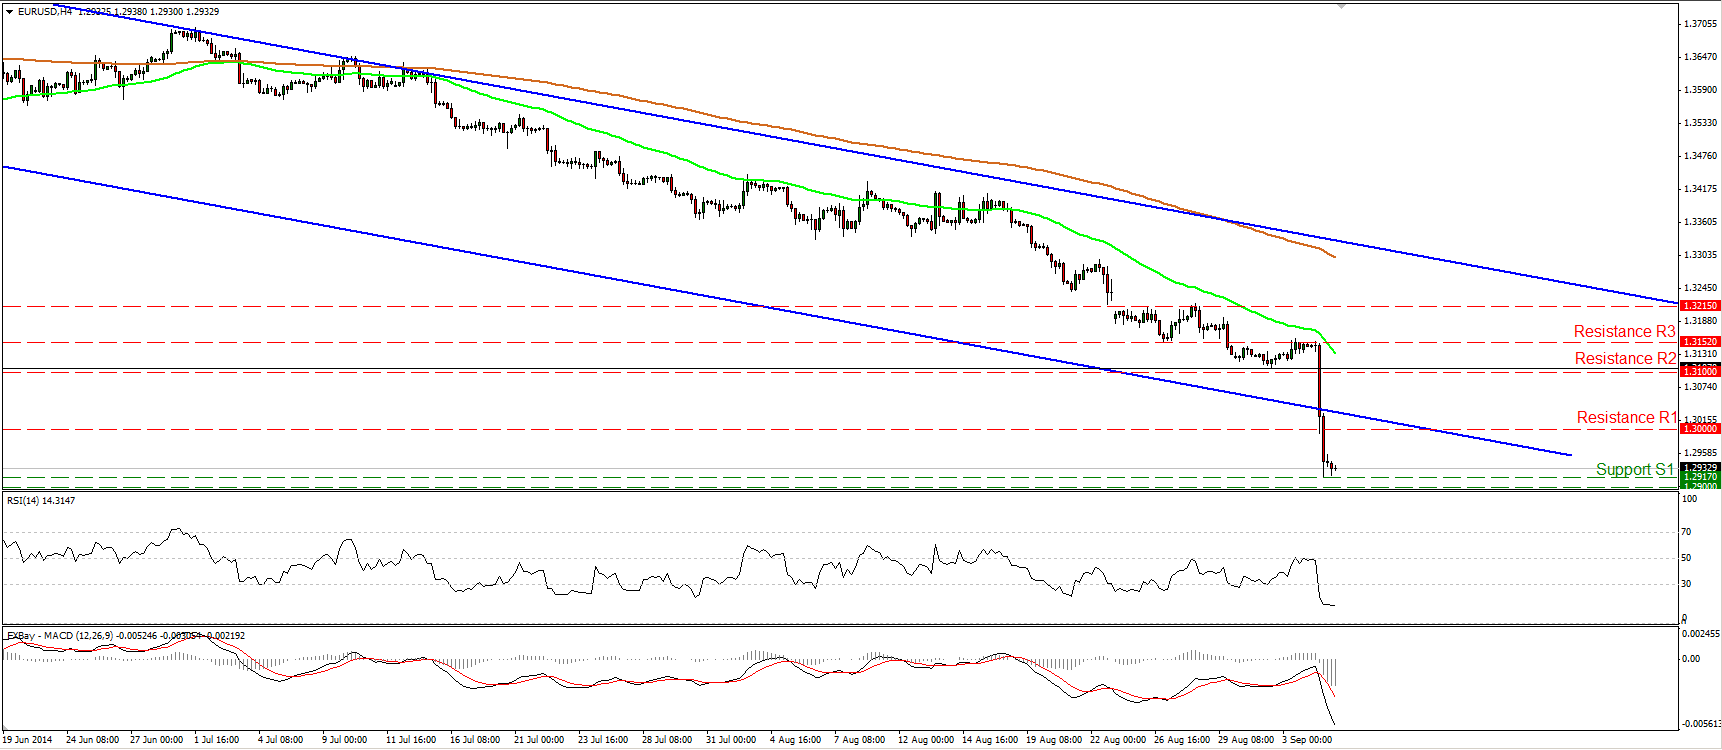
EUR/USD plunged on Thursday after the ECB decided to cut all its interest rates by 10bps and to start purchases of non-financial private sector assets. The pair fell below 1.3100 and the lower boundary of the blue downside channel (connecting the highs and the lows on the daily chart) at the rate decision, and later in the European afternoon, dipped below the psychological number of 1.3000. The tumble was halted at 1.2917 (S1), slightly above our support line of 1.2900 (S2). Although the bears may be reluctant to enter the market at these levels, a strong NFP print today is likely to encourage them to push the rate below 1.2900 (S2). Such a break is likely to pave the way towards the next key support zone of 1.2760 (S3), defined by the lows of March and July 2013.
• Support: 1.2917 (S1), 1.2900 (S2), 1.2760 (S3).
• Resistance: 1.3000 (R1), 1.3100 (R2), 1.3152 (R3).
USD/JPY reaches levels last seen back in September 2008
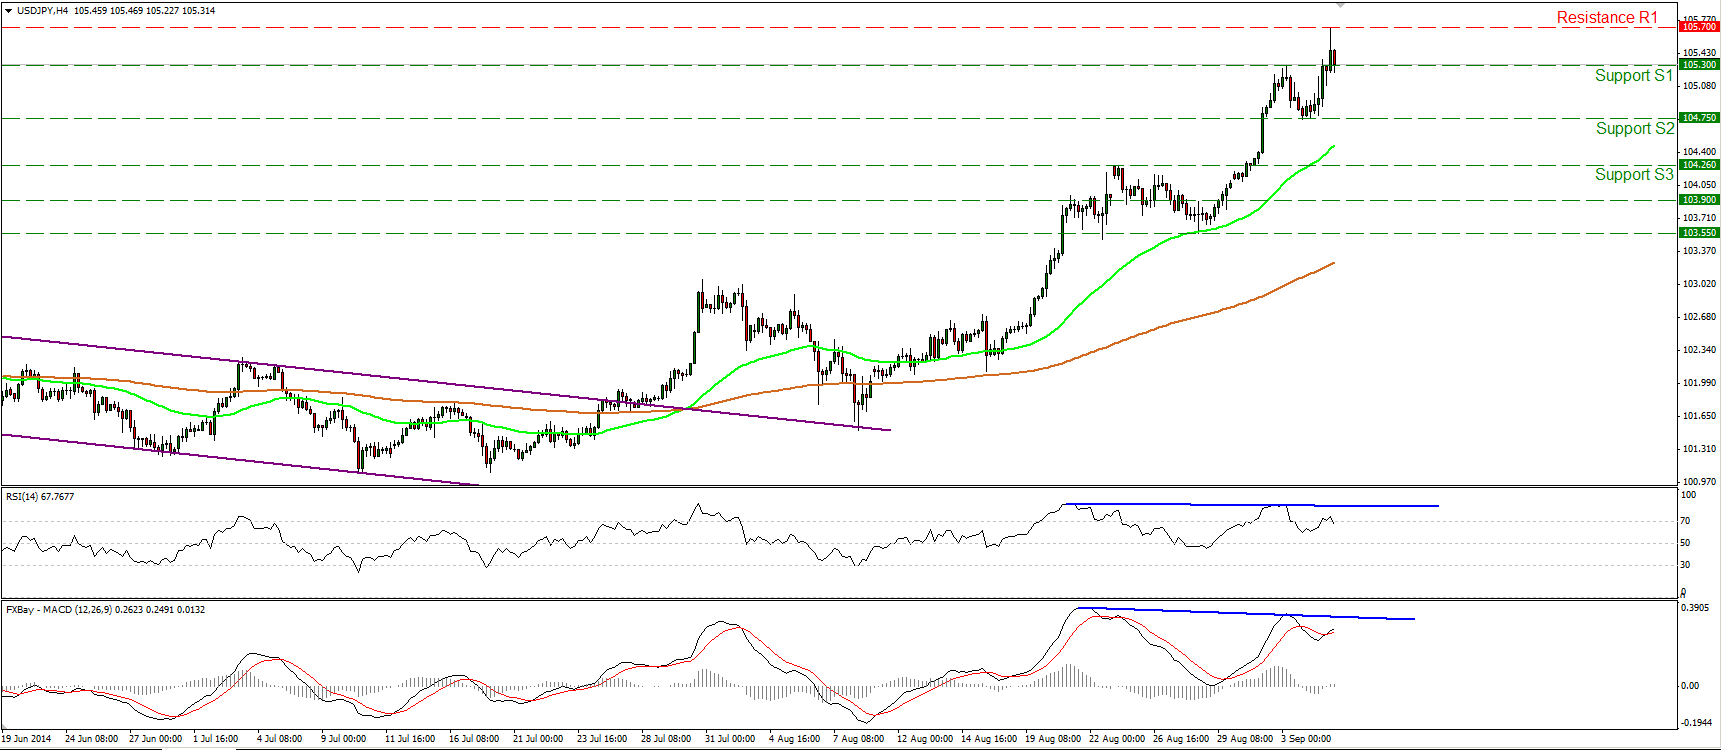
USD/JPY rebounded from 104.75 (S2) and surged to reach levels seen back in September 2008. The rate found resistance at 105.70 (R1), where a clear break could target the 106.00 (R2) line. Nevertheless, taking a look on our momentum studies, I see negative divergence between the price action and both the RSI and the MACD. As a result, I would be cautious for a possible corrective move before the bulls take the reins again. In the bigger picture, I still see a newborn long-term uptrend, since the price structure remains higher highs and higher lows above both the 50- and the 200-day moving averages.
• Support: 105.30 (S1), 104.75 (S2), 104.26 (S3).
• Resistance: 105.70 (R1), 106.00 (R2), 107.00 (R3).
EUR/GBP plunges on the ECB rate cuts
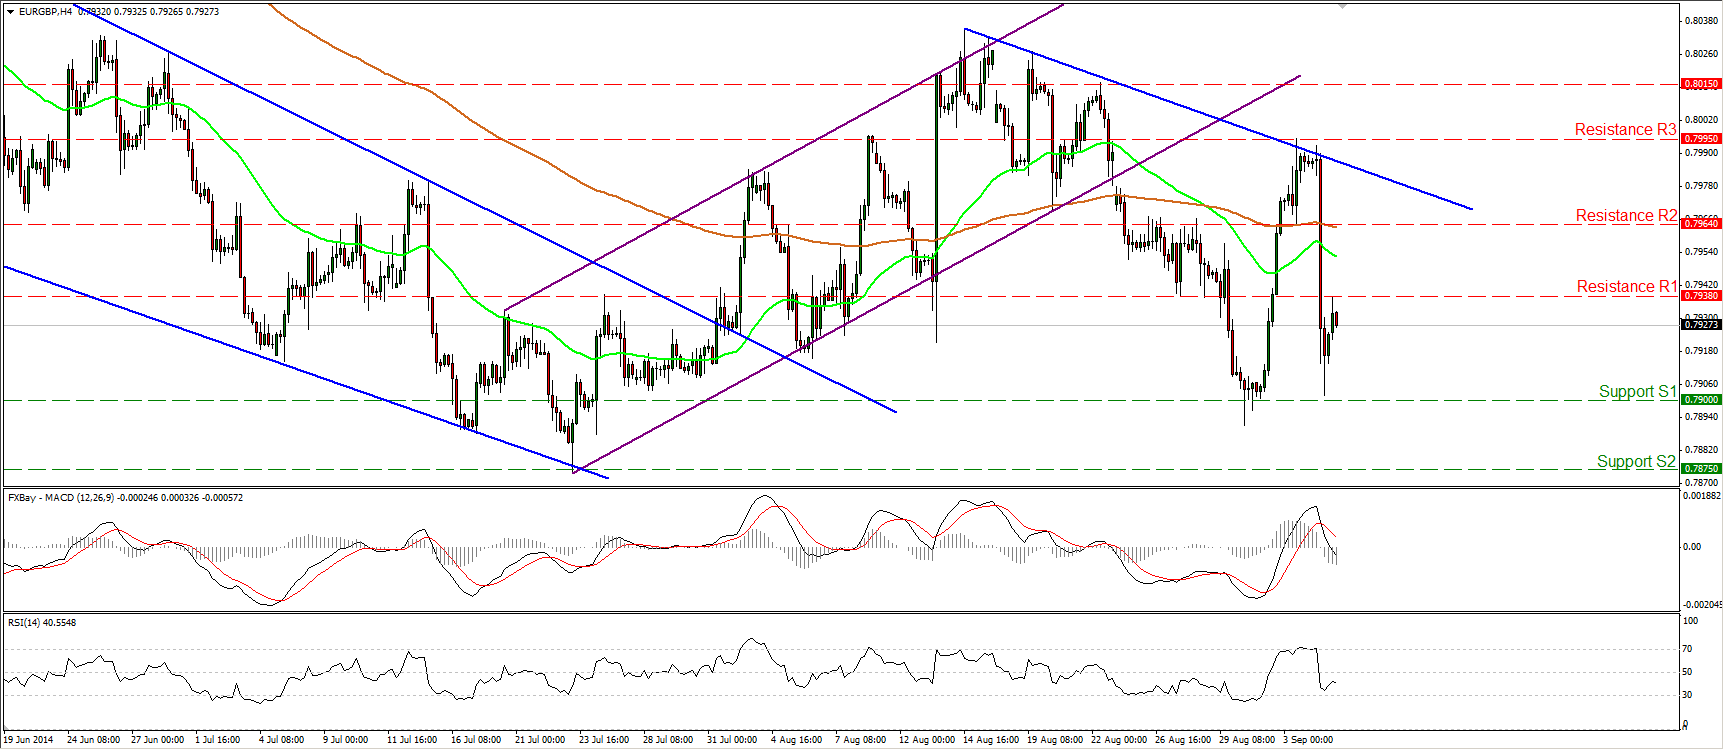
EUR/GBP also plunged after the ECB decided to cut all its interest rates. After the fall, the pair found support near the 0.7900 (S1) zone and rose somewhat to touch the 0.7938 (R1) line. As long as the possibility for a lower high still exist, I see a cautiously bearish picture. A decisive dip below the 0.7900 (S1) line could have bearish implications and could target the low of the 23rd of July at 0.7875 (S2). On the daily chart, the major downtrend is still intact, as defined by the downtrend drawn from back the high of the 1st of August 2013. Nevertheless, I would wait for a clear dip below 0.7875 (S2) before regaining confidence on that long-term downside path.
• Support: 0.7900 (S1), 0.7875 (S2), 0.7815 (S3).
• Resistance: 0.7938 (R1), 0.7964 (R2), 0.7995 (R3).
Gold dips near 1260 again
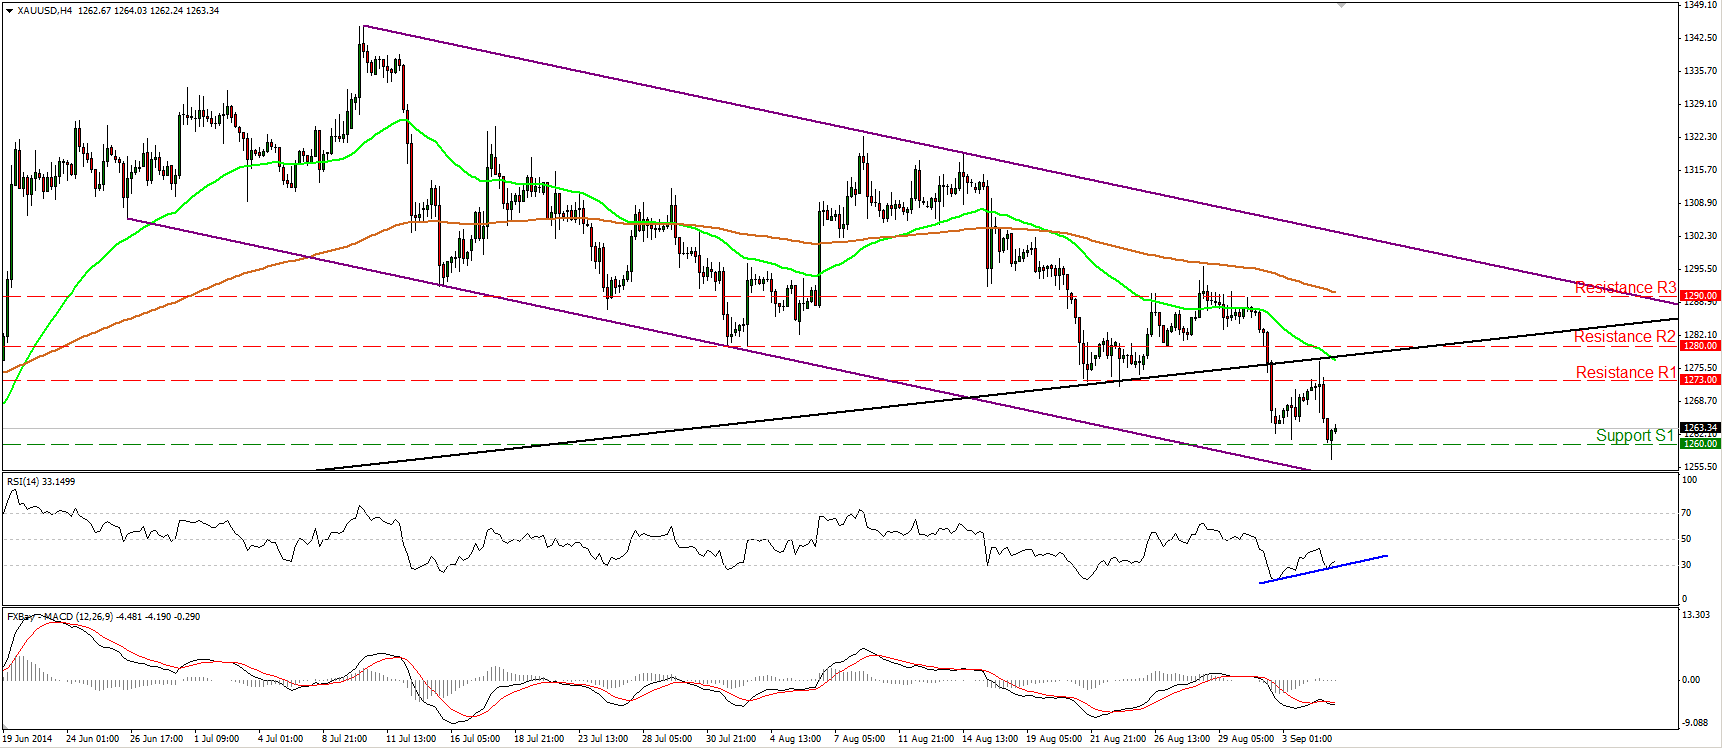
Gold moved lower yesterday, after finding resistance near the black long-term support line, drawn from back at the low of the 30th of December. Nevertheless, the metal found some buy orders, slightly below our support line of 1260 (S1). Taking into account that the metal is trading within the purple downside channel and below the aforementioned black long-term support line, I still see a negative overall outlook. A decisive move below 1260 (S1) could trigger extensions towards our next support obstacle, at 1250 (S2). My only concern is that, on the 4-hour chart, I see positive divergence between the RSI and the price action. However, on the daily chart, both our daily momentum studies follow downside paths, adding to the negative picture of gold.
• Support: 1260 (S1), 1250 (S2), 1240 (S3).
• Resistance: 1273 (R1), 1280 (R2), 1290 (R3).
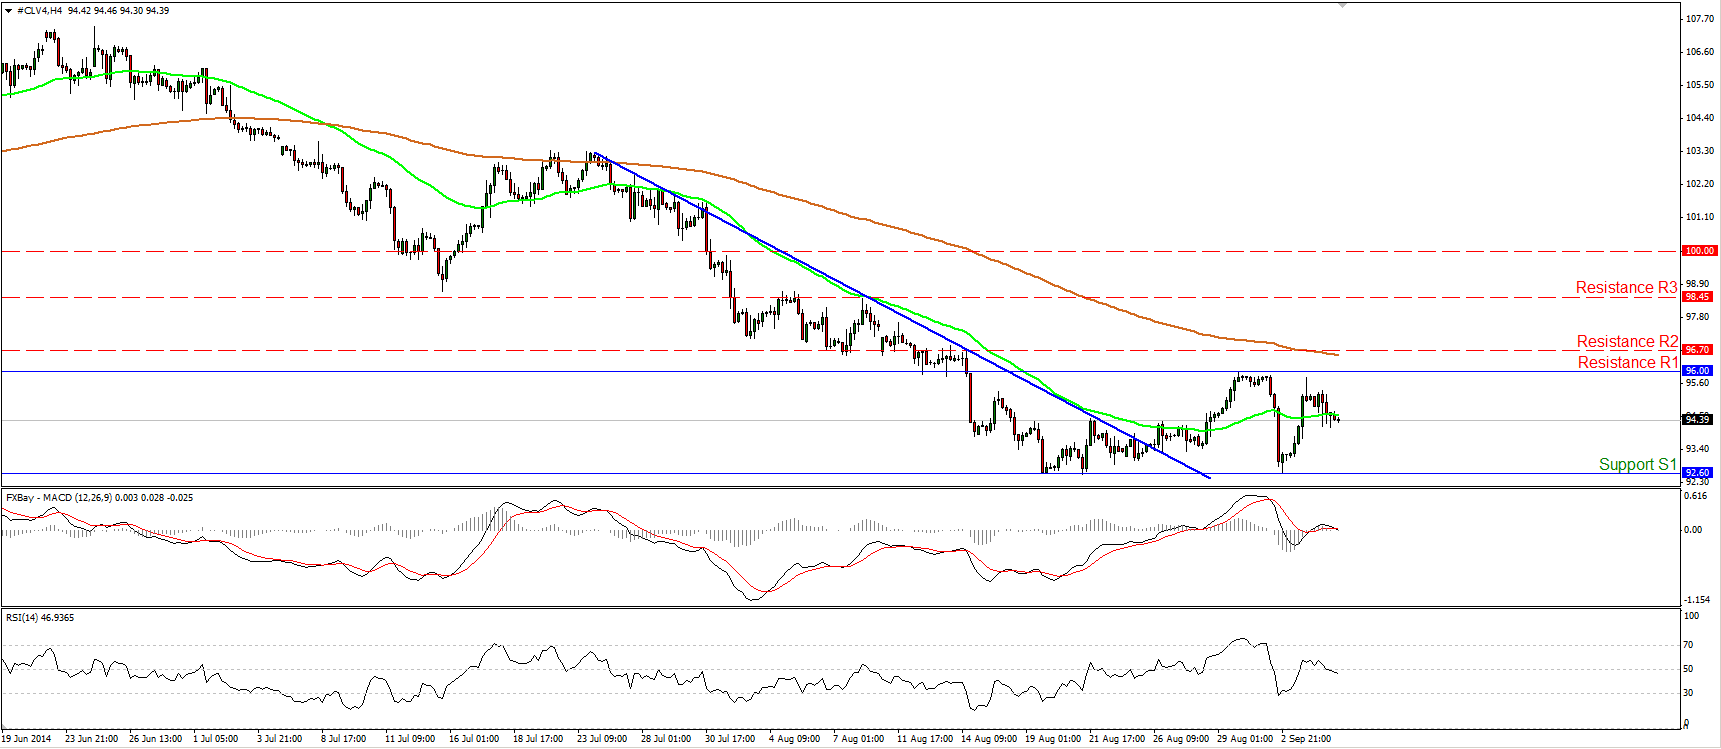
WTI finds resistance near 96.00 again
WTI moved lower after finding resistance near the 96.00 (R1) line again. As long as the price is trading between that barrier and the support of 92.60 (S1), I will consider the near-term path to be to the sideways and I will maintain my neutral stance. I will repeat that I would like to see a move above 96.70 (R2) to shift my attention to the upside. Such a move would confirm a forthcoming higher high and is likely to target the 98.45 (R3) barrier. Moving on the daily chart, although negative, the daily MACD is still in a rising mode, increasing the likelihood for the aforementioned upside break. On the downside, only a dip below 92.60 (S1), could signal the continuation of the prior downtrend.
• Support: 92.60 (S1), 91.60 (S2), 90.00 (S3).
• Resistance: 96.00 (R1), 96.70 (R2), 98.45 (R3).

