
As the markets gyrate, trying to decide on just what the next move is going to look like, I thought I’d answer a question a friend posed to me recently. He asked, what does the consumption basket look like today, compared with 25 years ago?
Eat More Chicken
The question was something of a challenge to me (well, more precisely to the BLS, who puts together the CPI) because my friend -- like so many others -- had heard that the BLS assumes that when the price of steak goes up, you eat more chicken and that the CPI doesn’t capture what may be construed as a decline in consumer welfare due to this effect.
The BLS doesn’t in fact make such determinations. In 1999, the BLS started using a geometric mean formula that captures the fact that consumers in fact tend to switch their consumption patterns towards items that have fallen in relative price. But that only affects items in the same very low-level “basic” category (the example the BLS gives is “different types of ground beef in Chicago”) and not at the higher levels like chicken-for-beef.
Moreover, an important point is that consumers will buy more of the item whose price relative to other goods has declined (say, chicken) even if the consumer is compensated for that change. Suppose a consumer pays $10 per week for soda, $5 each for Coke and Pepsi (which he considers interchangeable). Now suppose the price of Pepsi doubles, but the American Society for the Promotion of Cola Products sends the consumer $5. With the additional $5 he could continue to buy equal amounts of Coke and Pepsi, but will he? Of course not; the consumer will spend his $10 all on the cheaper brand and keep the extra $5, or buy more total cola by spending the entire $15 -- but all on the cheaper brand. The consumer’s utility/dollar is now much higher with one (formerly interchangeable) brand.
The Eight Major Groups
It is important that the BLS attempt to get the consumption basket to look as much like the average consumer’s consumption basket as possible, in order that the price index resembles as closely as possible a true cost of living index. So it doesn’t spend a lot of time guessing. Every few years, the BLS conducts a “Consumer Expenditure Survey” to collect information about spending habits from around 60,000 quarterly interviews and 28,000 detailed weekly purchase diaries gathered over a two year period. From these, the base weights are determined for about 200 item categories in dozens of cities and regions. These are then aggregated into successively larger groups consisting of the eight “major groups” (Food & Beverages, Housing, Apparel, Transportation, Medical Care, Other, Recreation and Education & Communication) and the overall CPI-U.
In short, the BLS does everything possible to avoid making value judgments about what is being spent. That said, studies have assessed the aggregate effect of substitution adjustments to be around 0.3% per year.
That said, how much have our spending patterns shifted in the CPI? Are we spending money dramatically differently than we did 25 years ago?
You can find the CPI weights for 1988 here and compare them to current weights found on p. 11 of the monthly CPI report. Be aware that the categories sometimes change over time so that, for example, in 1988 there was not an “Education and Communication” major category. But here are some comparisons: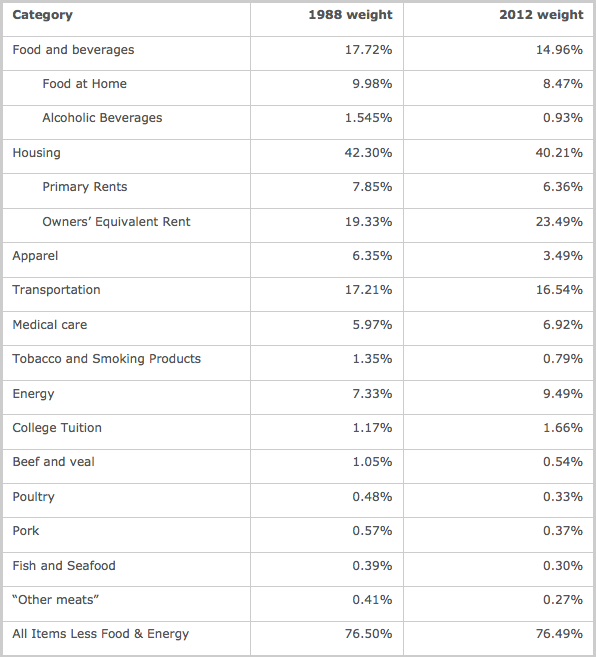
Consistently Consistent
Surprisingly, while we get a lot less for our money than we used to, our patterns of expenditure haven’t changed much, in aggregate. Sure, some of us are spending less on education while others spend more, simply because our patterns change as we go through life (and the BLS has some age-related indices as well). We spend, not surprisingly, less of our money today on clothes, food, alcohol, cigarettes, housing and transportation -- even with higher energy prices. Overall, though, we spend more on energy itself, on medical care and on tuition. You can see the effect of the ‘home ownership movement’ in the greater basket weight of “Owner’s Equivalent Rent” compared to “Primary Rents”. But overall, the spending patterns are evolutionary, not revolutionary.
Oh and we do spend less, as a portion of our total expenditure, on beef and veal! But we also spend less on chicken, pork, fish and “other meats” (shudder).
- English (UK)
- English (India)
- English (Canada)
- English (Australia)
- English (South Africa)
- English (Philippines)
- English (Nigeria)
- Deutsch
- Español (España)
- Español (México)
- Français
- Italiano
- Nederlands
- Português (Portugal)
- Polski
- Português (Brasil)
- Русский
- Türkçe
- العربية
- Ελληνικά
- Svenska
- Suomi
- עברית
- 日本語
- 한국어
- 简体中文
- 繁體中文
- Bahasa Indonesia
- Bahasa Melayu
- ไทย
- Tiếng Việt
- हिंदी
Fun With The CPI
Published 02/06/2013, 02:56 PM
Updated 02/22/2024, 09:00 AM
Fun With The CPI
Latest comments
Loading next article…
Install Our App
Risk Disclosure: Trading in financial instruments and/or cryptocurrencies involves high risks including the risk of losing some, or all, of your investment amount, and may not be suitable for all investors. Prices of cryptocurrencies are extremely volatile and may be affected by external factors such as financial, regulatory or political events. Trading on margin increases the financial risks.
Before deciding to trade in financial instrument or cryptocurrencies you should be fully informed of the risks and costs associated with trading the financial markets, carefully consider your investment objectives, level of experience, and risk appetite, and seek professional advice where needed.
Fusion Media would like to remind you that the data contained in this website is not necessarily real-time nor accurate. The data and prices on the website are not necessarily provided by any market or exchange, but may be provided by market makers, and so prices may not be accurate and may differ from the actual price at any given market, meaning prices are indicative and not appropriate for trading purposes. Fusion Media and any provider of the data contained in this website will not accept liability for any loss or damage as a result of your trading, or your reliance on the information contained within this website.
It is prohibited to use, store, reproduce, display, modify, transmit or distribute the data contained in this website without the explicit prior written permission of Fusion Media and/or the data provider. All intellectual property rights are reserved by the providers and/or the exchange providing the data contained in this website.
Fusion Media may be compensated by the advertisers that appear on the website, based on your interaction with the advertisements or advertisers.
© 2007-2024 - Fusion Media Limited. All Rights Reserved.