Get 40% Off
💰 Buffett reveals a $6.7B stake in Chubb. Copy the full portfolio for FREE with InvestingPro’s Stock Ideas toolCopy Portfolio

Full Metal (Gold And Silver) Price Manipulation Is Here

Published 08/17/2016, 01:41 AM
Updated 07/09/2023, 06:31 AM
XAU/USD
-
XAG/USD
-
GC
-
SI
-
GDXJ
-

I’m not sure of the significance of 20 minutes past the hour, and I’m sure it has some symbolic meaning to the gold manipulation cabal, but for the last week the price of gold has been getting slammed with an avalanche of Comex confetti at regular intervals at 20 minutes past the hour.
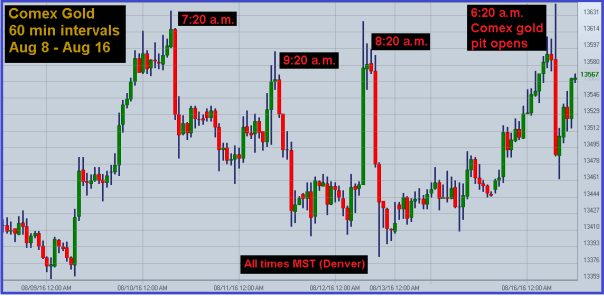
Comex Gold 60-Min Chart

THAT is not the graph of a market that is allowed to trade freely. But notice how gold bounces back sharply from every take-down attempt. This is especially significant given that this is one of the slowest seasonal periods of the year for the buyers of physical gold and silver.

This morning (Tuesday morning) was particularly blatant. Gold had traded steadily higher overnight from $1344 (December futures basis) to $1364 just after the Comex floor opened for business (8:20 a.m. EST/6:20 a.m. MST).

Whenever the elitists start to lose control of gold, they roll out one of their Fed stool pigeons to threaten the world with a 25 basis point (one quarter of one percent) rate hike at the next FOMC meeting (September).

Today’s park bench popcorn scavenger was NY Fed President, Bill Dudley, who stated on Fox Business that a rate hike in September is “possible.” I guess that means September’s meeting is a “live meeting” – a phrase Dudley and SF Fed Prez, John Williams, propagated the mainstream media propaganda meat grinder with in May.

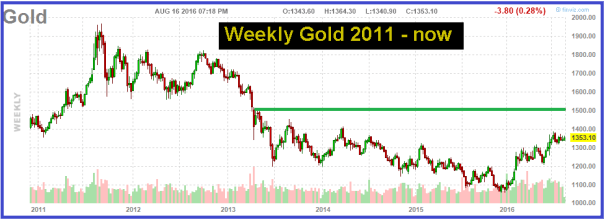
But gold shrugged off Dudley’s empty, straw-man threats and closed today respectably up about $5 from the close of yesterday’s afternoon “access market” trading session. I still believe that gold could see $1500 by Halloween despite the Comex B-52 paper bombs being dropped religiously on the market. And we are just one economic, political or societal catastrophe from gold making a rapid run toward $2,000.
3rd party Ad. Not an offer or recommendation by Investing.com. See disclosure here or remove ads .

Weekly Gold Chart: 2011-Now

Buy every manipulated sell-off in gold and silver. It’s the true “TINA” idea.

A lot of readers have asked me if it’s too late to buy mining stocks at this point. I refer them to a long-term graph of VanEck Vectors Junior Gold Miners (NYSE:GDXJ) so they can see where the junior miners have been relative to the level at which they bottomed.

It’s a prototypical chart of a market that is in the early stages of a massive move higher. The key is to identify the exploration companies that have a high probability of hitting the proverbial pot of gold. The last 5 years caused a lot of damage to the junior sector, but there’s a lot of companies with “a pulse” that have been revived, albeit significantly undervalued from a risk/return standpoint.

Latest comments

Great statement about the status quo in this world. Hit the nail right on the head.
Judging by what went on today, your article has made them move their paper dump to on the hour instead of 20 after now.
Risk Disclosure: Trading in financial instruments and/or cryptocurrencies involves high risks including the risk of losing some, or all, of your investment amount, and may not be suitable for all investors. Prices of cryptocurrencies are extremely volatile and may be affected by external factors such as financial, regulatory or political events. Trading on margin increases the financial risks.
Before deciding to trade in financial instrument or cryptocurrencies you should be fully informed of the risks and costs associated with trading the financial markets, carefully consider your investment objectives, level of experience, and risk appetite, and seek professional advice where needed.
Fusion Media would like to remind you that the data contained in this website is not necessarily real-time nor accurate. The data and prices on the website are not necessarily provided by any market or exchange, but may be provided by market makers, and so prices may not be accurate and may differ from the actual price at any given market, meaning prices are indicative and not appropriate for trading purposes. Fusion Media and any provider of the data contained in this website will not accept liability for any loss or damage as a result of your trading, or your reliance on the information contained within this website.
It is prohibited to use, store, reproduce, display, modify, transmit or distribute the data contained in this website without the explicit prior written permission of Fusion Media and/or the data provider. All intellectual property rights are reserved by the providers and/or the exchange providing the data contained in this website.
Fusion Media may be compensated by the advertisers that appear on the website, based on your interaction with the advertisements or advertisers.
© 2007-2024 - Fusion Media Limited. All Rights Reserved.