Get 40% Off
🤯 Perficient is up a mind-blowing 53%. Our ProPicks AI saw the buying opportunity in March.Read full update

FTSE: The Long And Short Of It - NXT, UTG, EMG, VSVS

Published 11/15/2019, 02:01 AM
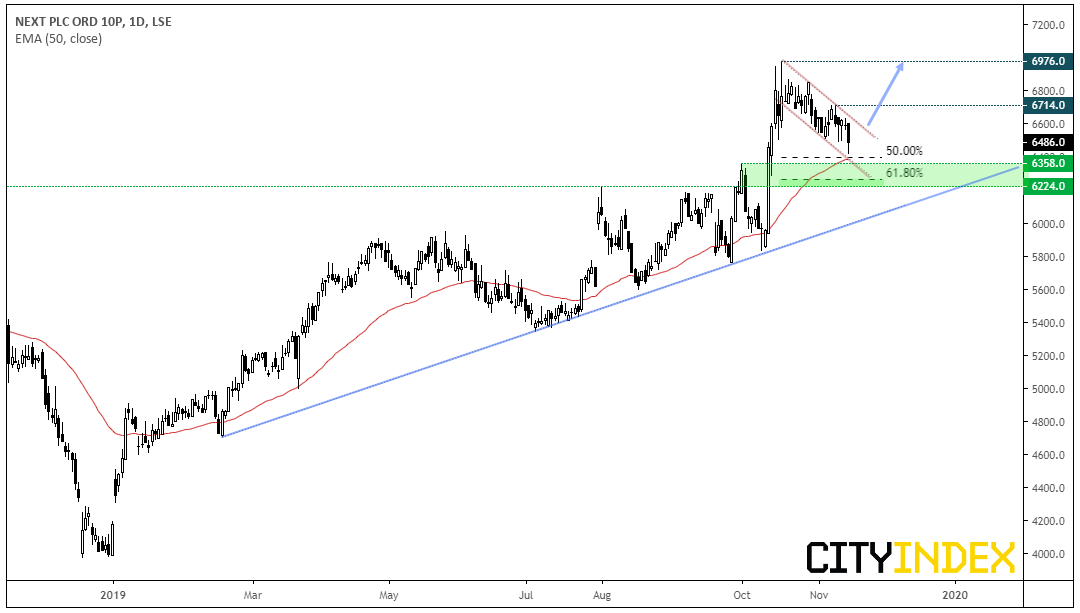
Next PLC Ord Daily Chart

Next CFD/DFT (NXT): Since breaking above key resistance around 6,225, prices rallied to 7,000 and are now gently retracing within a tight, corrective channel. Moreover, the 50-day eMA and 50% retracement level are nearby to act as potential support.
  • Bias remains bullish above 6,225, and for a retest and break of 7,000.
  • Bulls could look for a break of the retracement line or, for extra confirmation, wait for a break of a swing high such as 6,714.
  • Whilst yesterday’s bearish engulfing candle is a slight concern over the near-term, we’re looking for a base to build above 6,225 before its next leg high.
  • IWG is another equity consider as part of a similar setup, although price action on Next is more pleasing to the eye (being a higher liquidity stock).
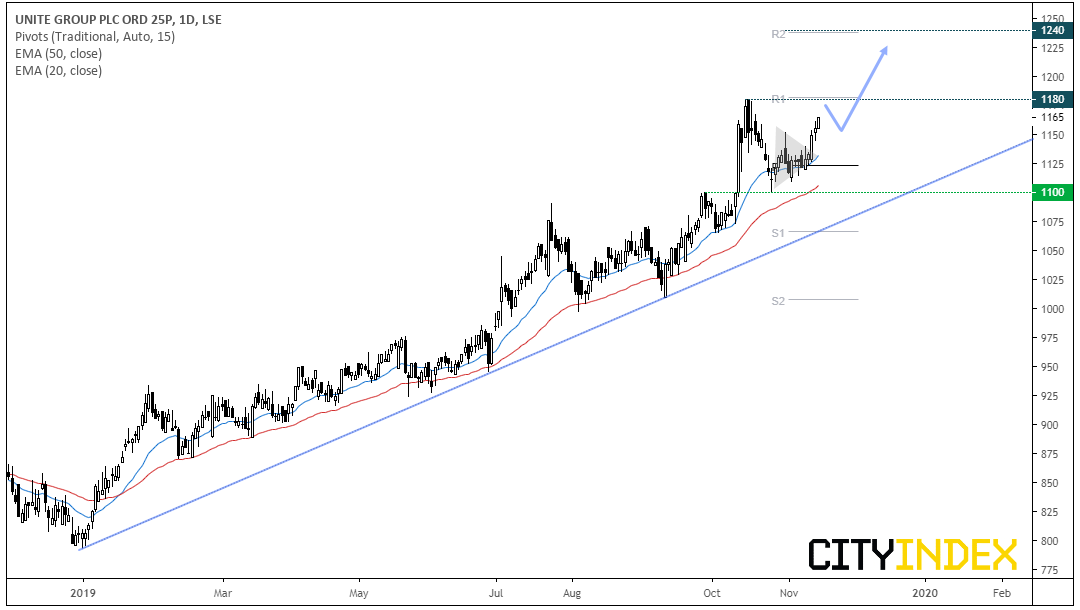
  • Unite Group CFD Daily Chart

    Unite Group CFD/DFT (UTG): The equity is locked in a strong uptrend, outperformed the FTSE and is on the cusp of outperforming its sector this year. After reaching 1180, it confirmed support at 1100, consolidated and is now eyeing up the 1180 highs once more.
  • Due to the strength of the underlying trend, the bias is for prices to break to new record highs.
  • The monthly R1 sits right on the highs, so this makes a likely target for intraday traders.
  • If trading from the daily timeframe, traders may want to wait for a break of 1180 or wait for prices to consolidate/retrace before seeking long setups.
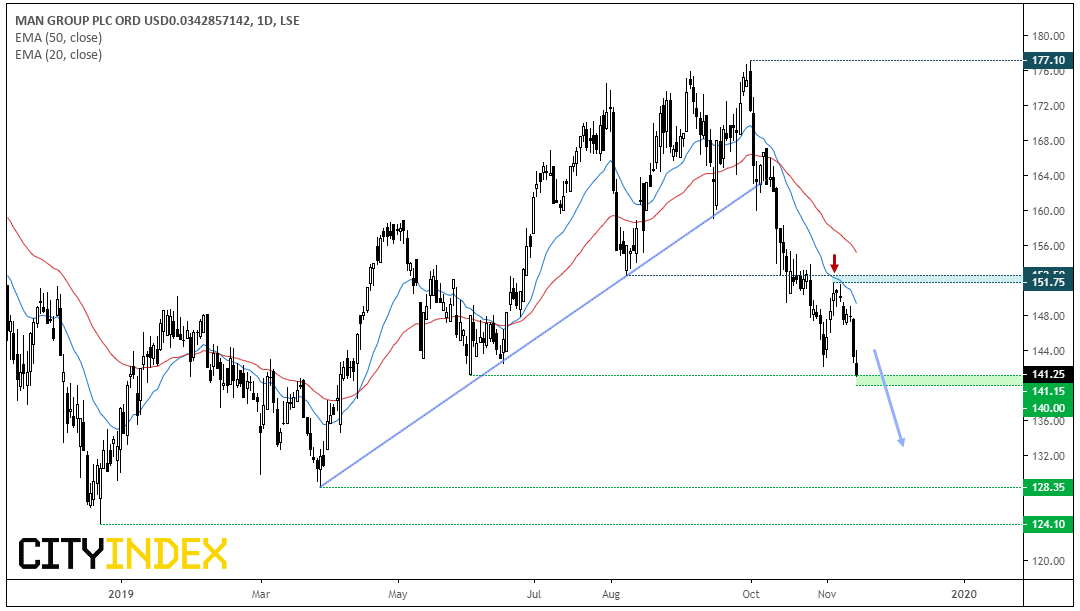
  • Man Group PLC Daily Chart

    Man Group (EMG): Since the October peak, Man Group has shed just over 20% which places it within a technical bear market. The initial move towards 141 was relatively direct, only pausing slightly ahead of its break of the bullish trendline. Having retraced towards the 20-day eMA and stalling below 152.50 resistance, bearish momentum has returned and its on the cusp of breaking key support.
  • The trend remains bearish beneath 151.75.
  • A break of 140 brings the 128.35 low into focus for bears.
  • Given positive sentiment for stocks ahead of the open (from Kudlow’s trade headlines) then perhaps support will hold this session. Regardless, bearish momentum since October is far more aggressive then the bullish momentum seen between January and October, so a downside break remains the bias.
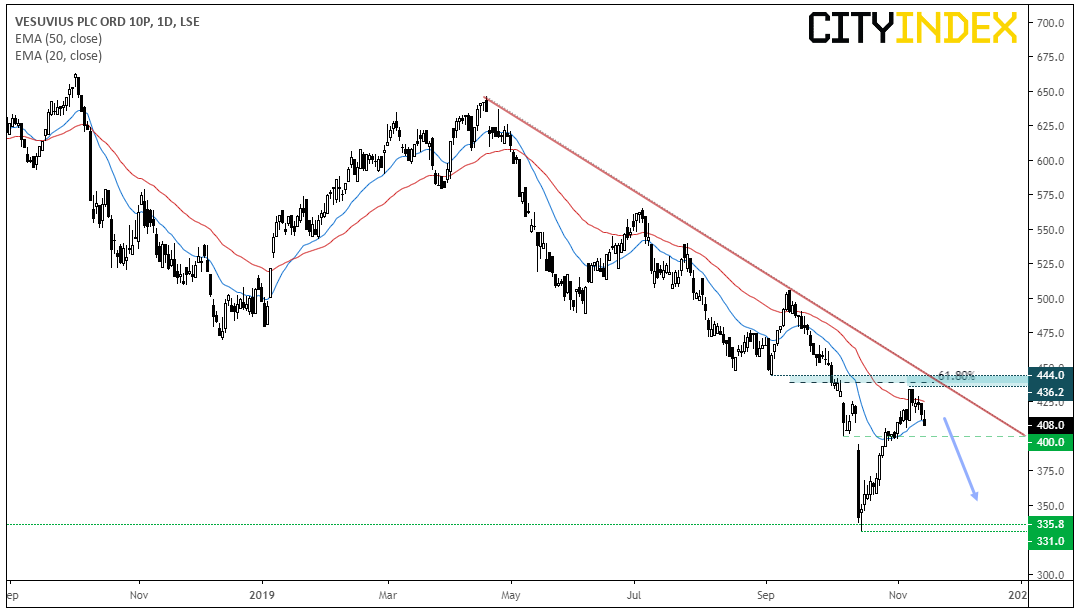
  • Vesuvius PLC Daily Chart

    Vesuvius CFD/DFT (VSVS): Having pulled back to the 61.8% Fibonacci ratio, a swing high has formed and bearish momentum is returning. The peaks are timely and prices are accelerating away from the trendline, so we think the high is likely in. Ultimately, it appears to be an ideal candidate for bearish swing traders.

  • The bias remains bearish below 444 and / or beneath the bearish trendline.
  • Being a round number, 400 could provide support initially although an eventual downside break is favoured.
  • Whilst the bearish trend hold, we could see this head for the lows around 331-335 or even break beneath them.
  • Price Action Update

    Avast CFD/DFT (AVA): Prices have only risen since breaking out of its bullish triangle. However, prices are now consolidating around 440 (right on the monthly R1 pivot) and extended from their averages, so we’d prefer to see a retracement or new level or support form before reconsidering potential longs.

    Aveva Group plc CFD/DFT: The bullish trend remains strong and on our radar, having hit and broken through target. Yet just like Avast, its extended from its moving averages more than we’d like and lacks any sort of compression. So we’ll keep a loose eye on it and hopefully it will provide another entry point as we head towards Santa’s rally.

    Greggs CFD/DFT: Key support held and it opted for the counter-bias by breaking back above the 200-day eMA and rallying higher. We may have seen a breakaway gap after completing a 3-wave correction around 720. If so, it should now head for and break to new highs. At time of writing, 2146 resistance stands in its way – we’re just waiting for prices to consolidate a little more before considering its potential for a breakout.

    Original Post

    3rd party Ad. Not an offer or recommendation by Investing.com. See disclosure here or remove ads .

    Latest comments

    Risk Disclosure: Trading in financial instruments and/or cryptocurrencies involves high risks including the risk of losing some, or all, of your investment amount, and may not be suitable for all investors. Prices of cryptocurrencies are extremely volatile and may be affected by external factors such as financial, regulatory or political events. Trading on margin increases the financial risks.
    Before deciding to trade in financial instrument or cryptocurrencies you should be fully informed of the risks and costs associated with trading the financial markets, carefully consider your investment objectives, level of experience, and risk appetite, and seek professional advice where needed.
    Fusion Media would like to remind you that the data contained in this website is not necessarily real-time nor accurate. The data and prices on the website are not necessarily provided by any market or exchange, but may be provided by market makers, and so prices may not be accurate and may differ from the actual price at any given market, meaning prices are indicative and not appropriate for trading purposes. Fusion Media and any provider of the data contained in this website will not accept liability for any loss or damage as a result of your trading, or your reliance on the information contained within this website.
    It is prohibited to use, store, reproduce, display, modify, transmit or distribute the data contained in this website without the explicit prior written permission of Fusion Media and/or the data provider. All intellectual property rights are reserved by the providers and/or the exchange providing the data contained in this website.
    Fusion Media may be compensated by the advertisers that appear on the website, based on your interaction with the advertisements or advertisers.
    © 2007-2024 - Fusion Media Limited. All Rights Reserved.