Actionable ideas for the busy trader delivered daily right up front
- Friday uncertain.
- ES pivot 1650.92. Holding below is bearish.
- Next week bias uncertain technically.
- Monthly outlook: bias higher.
- ES Fantasy Trader standing aside..
Thursday was a perfect example of the limits of technical analysis. I had called Thursday higher and the Dow was indeed putting in some modest gains - until some byg wyg at the SF Fed opened his mouth. Obviously last night I neglected to take the John Williams factor into account. So with this red ink baked into the close, let's now see how that might change the picture for Friday.
The technicals (daily)
The Dow: The Dow's Thursday afternoon sell-off caused the candle to end up as a bearish harami. Intraday, the Dow was also stymied at a high of 15,300, the same place it stopped on Wednesday. The indicators have come down a bit, but remain overbought. And we remain very much inside a rising RTC. One should also remember that the Dow has not had more than one consecutive down day since April 18th, when it had two. And there was only one other instance of two down days in a row all year. There have been no runs greater than two. Given this, I am hesitant to call for more downside on Friday.
The VIX: Meanwhile the VIX did gain 2.03% on Thursday but did it with a doji and that was only enough to hit 13, the top of its latest trading range. The indicators have risen considerably towards overbought on what amounts to very little real movement here. Based on the recent pattern, I'd have to guess the VIX is going lower on Friday.
Market index futures: Unlike recent nights where the futures were little changed at this hour, tonight all three futures are higher at 1:06 AM EDT with ES up by 0.14%. Like the trans, Thursday's candle was just barely a dark cloud cover. However, ES remains well inside its rising RTC and the overnight seems to be suggesting some retracement of Thursday's losses may be in the offing. I would not be surprised to see Friday finish with a green candle.
ES daily pivot: Tonight the pivot dips from 1652.25 to 1650.92. Amazingly, ES, which had been trending higher all evening to just below the old pivot took an abrupt turn south just before midnight to remain below the new pivot. After one quick failed attempt at 12:30 AM to break above, it is now simmering just below. It's bearish on the face of it, but ES does seem to have some interest in mounting another attack. A successful breach would be a positive sign.
Dollar index: Last night I said that "I'll claim that the dollar may be headed lower on Thursday" and the evening star played out well, with the dollar dropping 0.28%. Even at that it remains overbought and the stochastic is just forming a bearish crossover, so I'd expect continued lower on Friday.
Euro: On Thursday the euro exited its descending RTC for a bullish setup. The overnight candle is also outside this channel so that's a bullish trigger. That may be for naught though since the euro gave up all of the day's gains and is now down 0.33% as it continues to dribble down its lower BB. At this stage, I'd expect to see it hit support at 1.2783 sometime next week. I really see no strength here.
Transportation: After two strong days, the trans gave up 0.80% on Thursday. The candle is a dark cloud cover, just barely, but again given the strong momentum so far this year, I need confirmation of this reversal warning before calling an end to the uptrend.
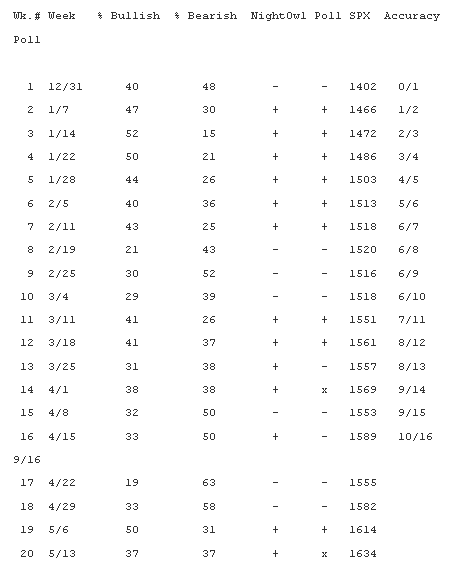
Sentiment: Once again it's time for the latest weekly TickerSense Blogger Sentiment Poll. We continue to track the poll to see how well it performs.
Again, the SPX number is the closing price of the S&P on the Friday before each new poll comes out. The "NightOwl" column is how I voted. The "Poll" column is how the majority of participants voted. Since the poll is for 30 days out, after the first four weeks we're able to see how well we did. This week we see that I voted bullish four weeks ago, so that was correct. However, the poll as a whole voted bearish, so I was right and they were wrong (nyah nyah). We continue the year with an accuracy of 10 for 16, or 63%. The poll as a whole drops to 9 for 16 or 56%.
This week, amazingly we have yet another tie, the second of the year with bulls and bears both at exactly 37.04%. My own vote remains bullish. I see no end in sight to the rising RTC on both the weekly and monthly charts.
Friday is op-ex and historically this one is pretty weak. We also have some candlestick reversal signs on a few charts that weren't there last night. But we have yet to see the two bearish indicators I consider the most important - a stochastic crossover and an RTC exit. Also, the VIX is showing very little interest in moving higher, suggesting that Thursday's Fed noises may not be spooking Mr. Market all that much. I'm not really seeing much incentive for a move lower. On the other hand, we seem to be having some difficulties advancing from here. So what I really think will happen is simply more sideways action, possibly a doji on Friday. Accordingly, the call is uncertain.
ES Fantasy Trader
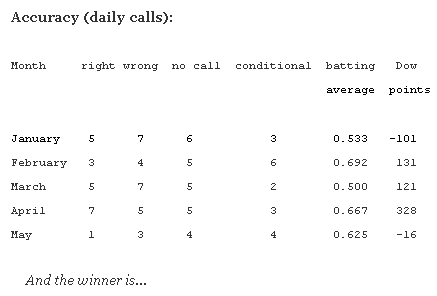
Portfolio stats: the account remains at $107,750 after 11 trades (9 for 11 total, 4 for 4 longs, 5 for 7 short) starting from $100,000 on 1/1/13. Tonight we stand aside again with another "uncertain" call.
