Upcoming US Events for Today:- Existing Home Sales for January will be released at 10:00am. The market expects 4.65M versus 4.87M previous.
Upcoming International Events for Today:
- Great Britain Retail Sales for January will be released at 4:30am EST. The market expects a year-over-year increase of 5.0% versus an increase of 5.3% previous.
- Canada CPI for January will be released at 8:30am EST. The market expects a year-over-year increase of 1.3% versus an increase of 1.2% previous.
- Canada Retail Sales for December will be released at 8:30am EST. The market expects a month-over-month decline of 0.4% versus an increase of 0.6% previous.
The Markets
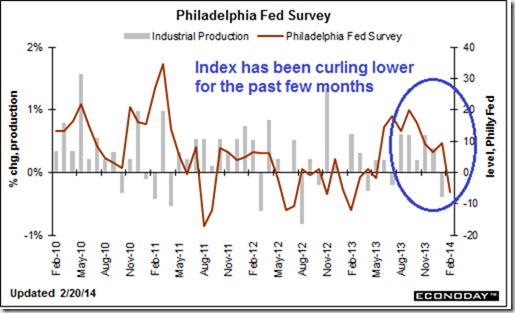
Stocks posted firm gains on Thursday despite a mixed set of reports pertaining to manufacturing in the US. The Philadelphia Fed Index, which provides a reasonable gauge of business conditions on the east coast, reported that activity over the past month had contracted with a headline print of –6.3. Analysts were expecting activity to have expanded, printing an 8.0, just shy of last month’s report of 9.4. Weather is once again deemed to be the contributing factor to the weak report. Equity benchmarks in the US are generally positively correlated to the direction of the Philly Fed index given the correlation the report has to economic fundamentals. As the index trends higher or holds stable in positive territory, equity market strength typically follows. Conversely, as the index trends lower or holds stable in negative territory, equity market weakness is a reasonable expectation. Despite this one weak report that is being pegged to the inclement weather conditions in the US Northeast, the index has been curling lower for a few months now, providing concerns pertaining to economic growth in the US. Should conditions not improve, the reasonable expectation would be that equity prices will follow. Manufacturing in the US typically picks up between March and May, a trend that the Philly Fed Index has yet to show.
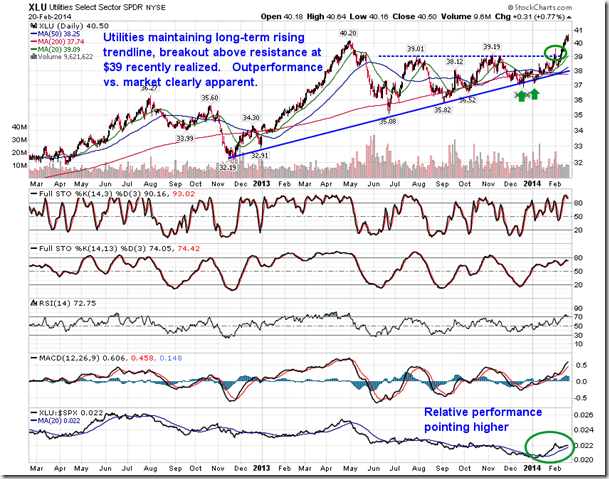
However, contradicting the weak Philly Fed report was Markit Economics’ advanced manufacturing index, which reported as strong expansion in business conditions with a headline print of 56.7, the highest level in almost four years. Readings above 50 indicate expanding manufacturing conditions, while readings below imply contraction. The result gave boost to economically sensitive sectors, mainly Materials and Industrials, which led equity markets higher on the session. Sector performance since the start of the year remains fairly defensive with Utilities and Health Care being two of the few sectors posting gains on the year; performance relative to the broad market remains very positive. The Materials and Technology sectors round out the only four sectors that have outperformed the S&P 500 since the year began. Consumer and Financial sectors have been amongst the weakest preforming stocks. Overall, a defensive tone is apparent, but it remains difficult to separate out the effects of the abnormal winter weather in the sector activity. The key test will likely come over the course of the next month as winter reaches an end (hopefully) and warmer weather re-emerges into the Spring.
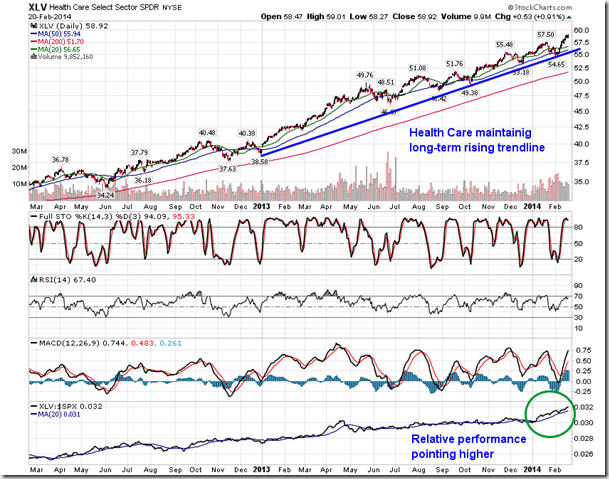
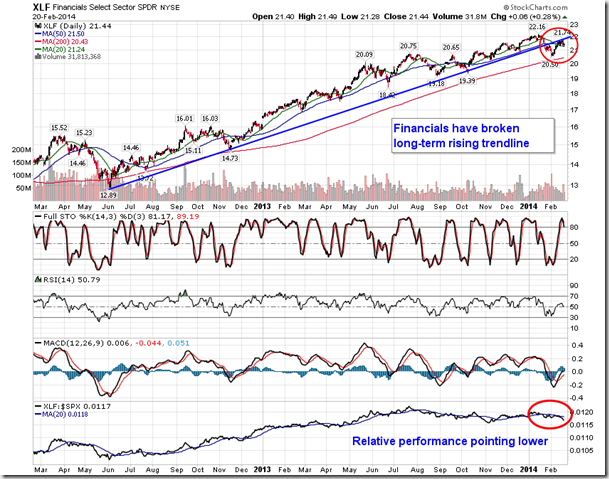
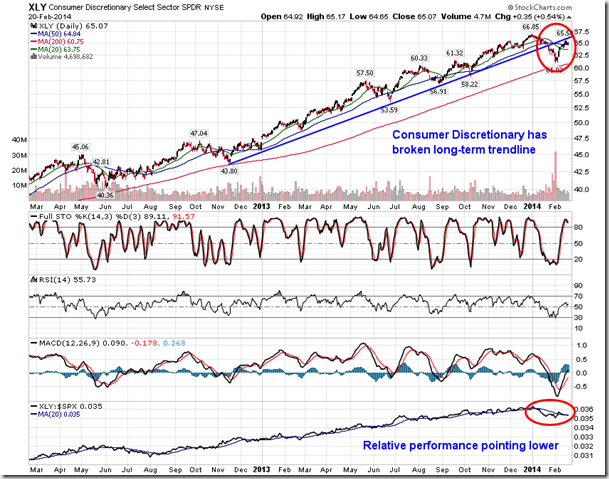
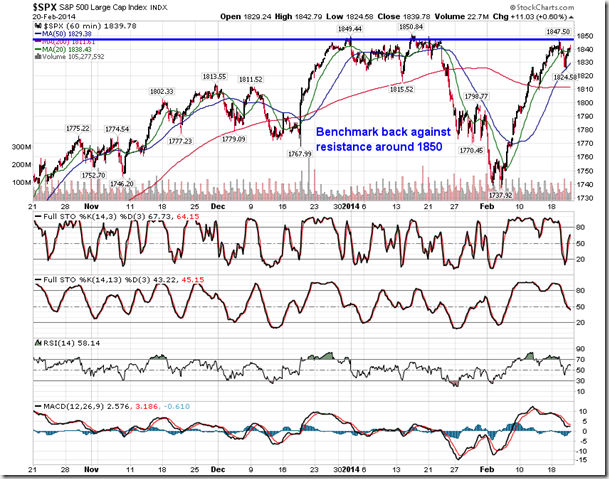
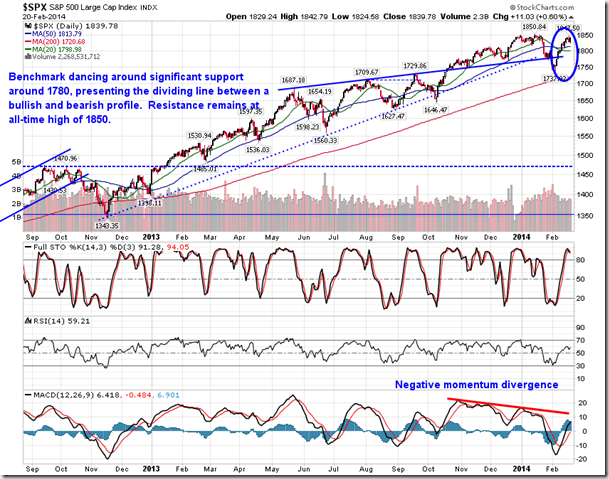
The gains on Thursday have pushed the S&P 500 back against resistance presented by the all-time high around 1850. The risk of a lower-high below the January peak remains, which, if confirmed, would suggest an end to the positive intermediate trend that has lifted stocks for over a year; a flat to negative intermediate trend would then be assumed.
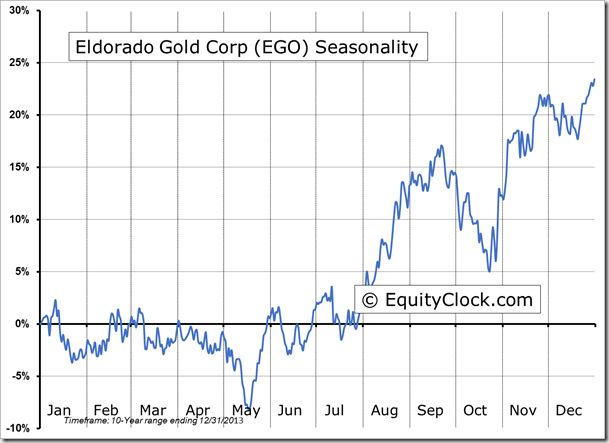
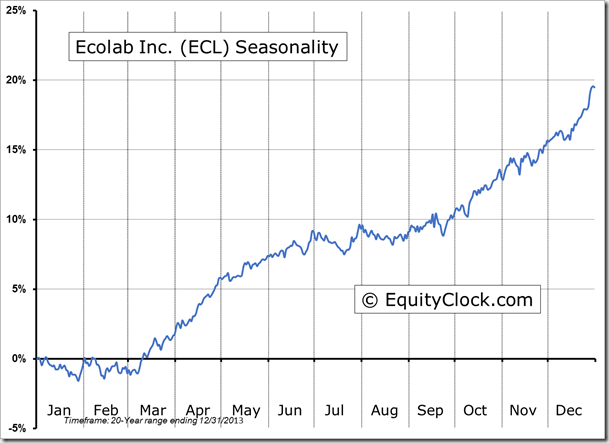
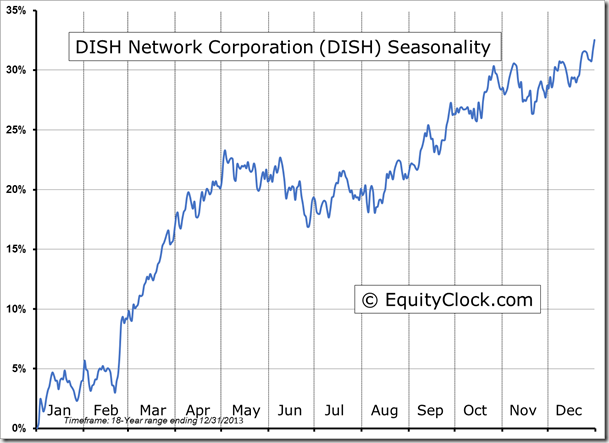
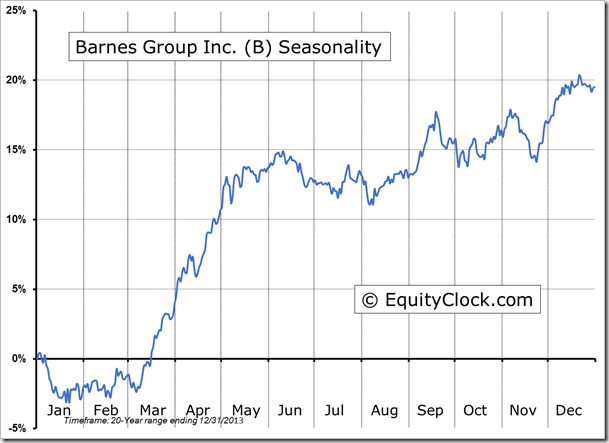
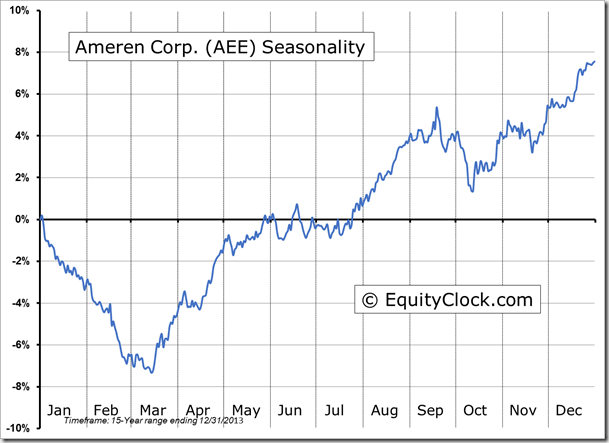
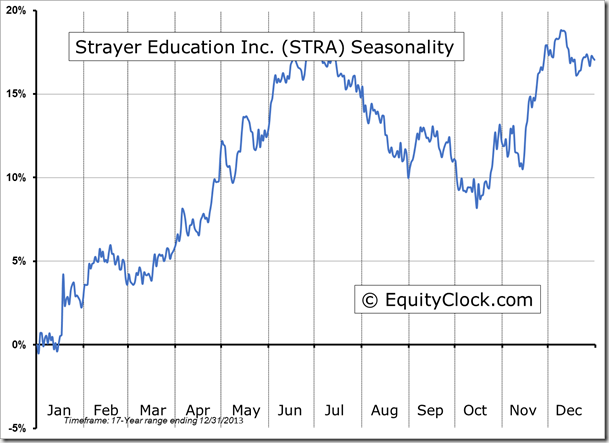
Seasonal charts of companies reporting earnings today:
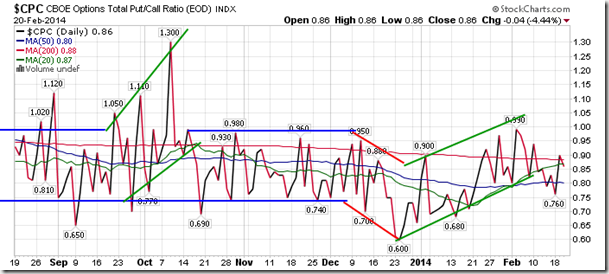
Sentiment on Thursday, as gauged by the put-call ratio, ended bullish at 0.86.
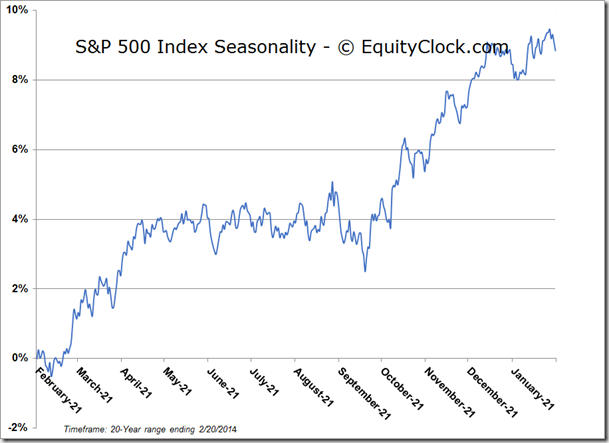
S&P 500 Index
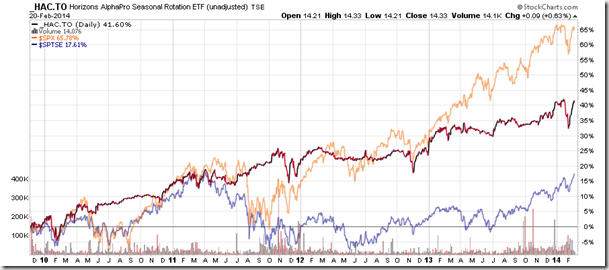
Horizons Seasonal Rotation ETF (TSX:HAC)
- Closing Market Value: $14.33 (up 0.63%)
- Closing NAV/Unit: $14.33 (up 0.72%)
Performance*
| 2014 Year-to-Date | Since Inception (Nov 19, 2009) | |
| HAC.TO | 0.22% | 43.3% |
* performance calculated on Closing NAV/Unit as provided by custodian
