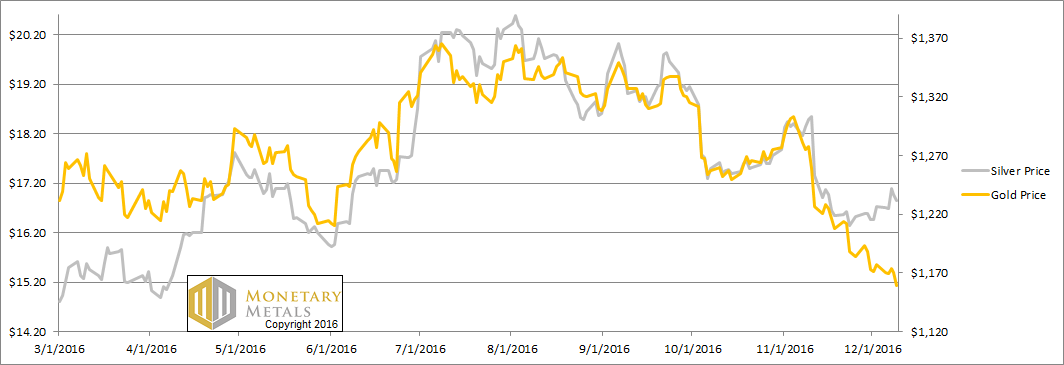
The price action was mixed this week. Those hoping for dollar declines in gold terms were disappointed. However, silver gave them a sop as the price of the buck declined by one one-hundredth of a gram of silver. In Monetarist terms, gold went down $18 and silver up 11 cents.
Monetarism, in its insistence that the dollar be used to measure gold, is in denial that the value of the dollar is unstable. Everyone knows that the Fed tries to devalue the dollar at 2 percent per annum (as it reckons it), yet insists on using it as the meter stick for measuring economic value.
The big story this week is the silver manipulation lawsuit. We remain flabbergasted that people think the price of a commodity could be suppressed by 75% (or a lot more, by some allegations) for years. We also note that the anger is not on the part of silver buyers. It’s would-be sellers who are upset. They wanted to sell at higher prices, and they allege the banks beat them to it, and the price fell before they could unload.
We will publish an article this week by Bron Suchecki, which looks into this scandal with our unique combination of economics, market mechanics, and data.
In this Report, we will give an update on those pesky fundamentals. But first, here’s the graph of the metals’ prices.
The Prices of Gold and Silver

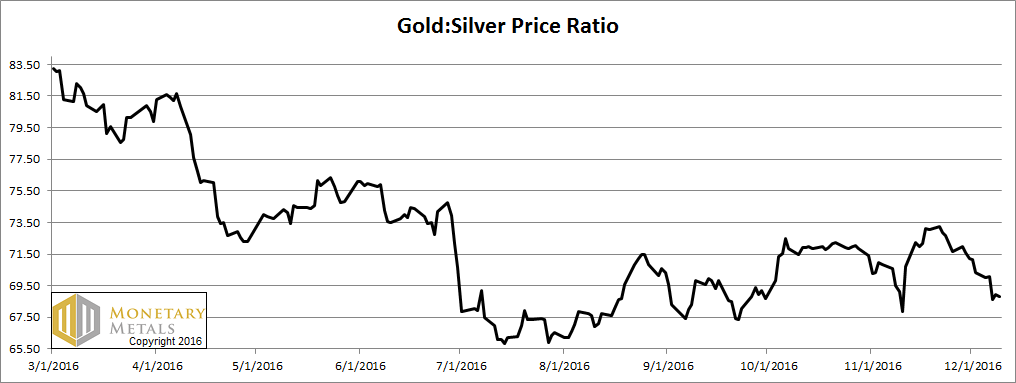
Next, this is a graph of the gold price measured in silver, otherwise known as the gold to silver ratio. It fell a bit more this week.
The Ratio of the Gold Price to the Silver Price

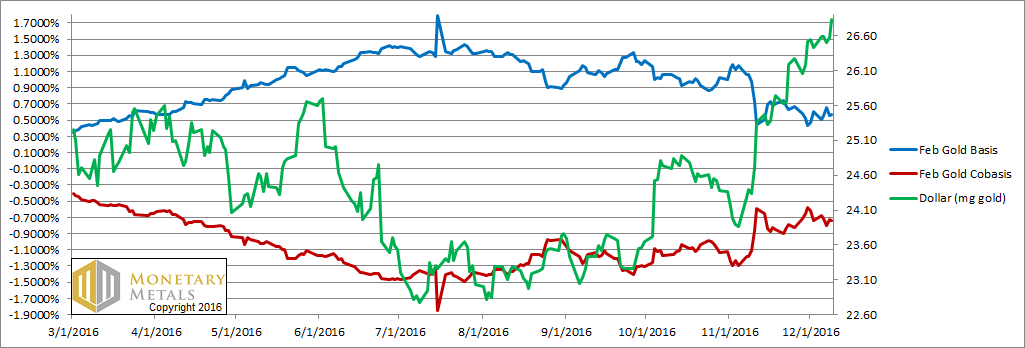
For each metal, we will look at a graph of the basis and cobasis overlaid with the price of the dollar in terms of the respective metal. It will make it easier to provide brief commentary. The dollar will be represented in green, the basis in blue and cobasis in red.
Here is the gold graph.
The Gold Basis and Cobasis and the Dollar Price

The price of gold fell (i.e. the price of the dollar rose, green line). Look at the dollar, shooting the moon on the top-right corner of the chart! This is bad for those hoping to buy dollars in the near future, as the same gold will buy fewer of the Fed’s Notes.
However, most people speculate heavily on the dollar and the majority of their wealth is in either dollar-denominated securities or in the form of credit granted to the Fed and the banks. That speculation worked out well this week, as it has for the second half of this year.
Our measure of gold’s scarcity, the cobasis, moved sideways while the price of gold dropped. Unsurprisingly, our calculated fundamental price of gold fell again. It’s now $1,190.
Now let’s look at silver.
The Silver Basis and Cobasis and the Dollar Price

In silver, we see an 11-cent rise in price but the cobasis is falling.
Our calculated fundamental price moved up to over $15.
The speculation in the wake of the Italian referendum last weekend did not hold. Nor did a bigger wave on Wednesday, which took the price to over $17.20. The fundamentals act as an anchor. It’s no guarantee of a price change in the immediate term, but over the intermediate to longer term, they’re an anchor. Friction and gravity will win in the end (unless the fundamentals change before then).
