
Fresenius Medical Care AG & Co. KGaA (NYSE:FMS) reported adjusted earnings per share (EPS) of 52 cents in the second quarter of 2019, which missed the Zacks Consensus Estimate of 55 cents. The bottom line also declined 3.7% year over year.
Revenues fell 2.9% year over year to $4.88 billion but surpassed the Zacks Consensus Estimate of $4.78 billion.
Segmental Details
In the second quarter, Fresenius Medical reported through two segments — Health Care Services and Health Care Products.
Health Care Services revenues increased 2% on a year-over-year basis but fell 2% at cc. The decline at constant currency was primarily due to missing revenues from the divested Sound activities and closed or sold clinics.
Health Care Products revenues improved 7% year over year and 6% at cc. The upside was mainly driven by higher sales of home hemodialysis products, largely as a result of the NxStage acquisition, products for acute care treatments, peritoneal dialysis products and renal pharmaceuticals. Lower volume of sales of machines owing to changes in the accounting treatment for sale-leaseback transactions on account of the IFRS 16 implementation and lower sales of dialyzers in EMEA partially offset the upside.
Fresenius Medical Care AG & Co. KGaA Price, Consensus and EPS Surprise
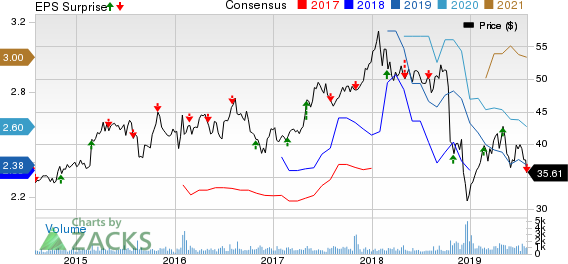
Fresenius Medical Care AG & Co. KGaA price-consensus-eps-surprise-chart | Fresenius Medical Care AG & Co. KGaA Quote
Geographical Growth
North America
Revenues in the region grew 3% year over year but fell 3% at cc. On organic basis, sales in the region improved 4%.
EMEA
Revenues in this region declined 1% year over year and remained flat at cc in the quarter. Per management, the performance was impacted by favorable business development in Health Care Services, offset by lower sales in Health Care Products.
Asia-Pacific
Revenues in this region increased 8% year over year and 7% at cc in the reported quarter. Per management, positive business development in both Health Care Services and Health Care Products led to the upside.
Latin America
Revenues in Latin America declined 5% year over year but improved 26% at cc. Organic growth in region was 24%.
Guidance Reiterated
For 2019, Fresenius Medical expects adjusted revenues to grow between 3% and 7%, and adjusted net income to develop in the range of a (2%) to 2%.
For 2020, this Zacks Rank #3 (Hold) company expects adjusted revenues and adjusted net income to grow at a mid to high-single digit rate.
Summing Up
Fresenius Medical reported mixed results in the second quarter. The company continues to gain from its Health Care Products and Services units, which witnessed revenue upside in the quarter under review. Revenues in the North American and EMEA regions also improved. In fact, management remains optimistic regarding the buyouts of Sound Physicians and NxStage Medical.
Furthermore, strong view for 2019 and 2020 paints a brighter picture. Management expects to undertake meaningful investments in 2019 to capitalize on growth opportunities and optimize cost base.
On the flip side, year-over-year decline in Latin American revenues raise concern.
Earnings of Other MedTech Majors at a Glance
Some better-ranked stocks which reported solid results this earning season are Stryker Corporation (NYSE:SYK) , Baxter International Inc. (NYSE:BAX) and Intuitive Surgical, Inc. (NASDAQ:ISRG) .
Stryker delivered second-quarter 2019 adjusted earnings per share of $1.98, beating the Zacks Consensus Estimate by 2.6%. Revenues of $3.65 billion surpassed the Zacks Consensus Estimate by 1.4%. The company carries a Zacks Rank of 2 (Buy). You can see the complete list of today’s Zacks #1 Rank (Strong Buy) stocks here.
Baxter delivered second-quarter 2019 adjusted earnings of 89 cents per share, which surpassed the Zacks Consensus Estimate of 81 cents by 9.9%. Revenues of $2.84 billion outpaced the Zacks Consensus Estimate of $2.79 billion by 1.9%. The company has a Zacks Rank #2.
Intuitive Surgical reported second-quarter 2019 adjusted earnings per share of $3.25, which beat the Zacks Consensus Estimate of $2.85. Revenues were $1.1 billion, surpassing the Zacks Consensus Estimate of $1.03 billion. The company sports a Zacks Rank #1.
More Stock News: This Is Bigger than the iPhone!
It could become the mother of all technological revolutions. Apple (NASDAQ:AAPL) sold a mere 1 billion iPhones in 10 years but a new breakthrough is expected to generate more than 27 billion devices in just 3 years, creating a $1.7 trillion market.
Zacks has just released a Special Report that spotlights this fast-emerging phenomenon and 6 tickers for taking advantage of it. If you don't buy now, you may kick yourself in 2020.
Click here for the 6 trades >>
Intuitive Surgical, Inc. (ISRG): Free Stock Analysis Report
Fresenius Medical Care AG & Co. KGaA (FMS): Free Stock Analysis Report
Baxter International Inc. (BAX): Free Stock Analysis Report
Stryker Corporation (SYK): Free Stock Analysis Report
Original post
Zacks Investment Research