Happy new year everyone and what a start we have as the first trading day finds markets open in deep red and dollar getting a good beating as USD/JPY signals risk off.
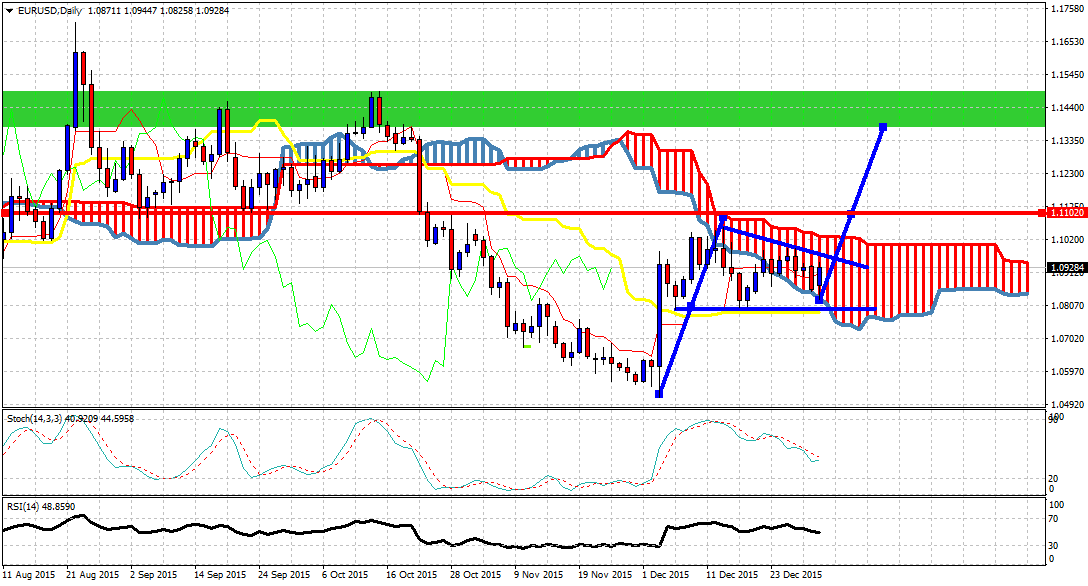
This pair is mostly trading sideways in what can be seen as a triangle pattern with important resistance at 1.0990 and the bullish scenarios open for a move towards the big resistance levels confluence at 1.13-1.14. Intermediate important resistance is at 1.11. Support that should be held is at 1.08. Losing that level will open the road for a re-test of 1.05.
With a new throw over new low below and out of the downward sloping wedge, GBP/USD does not strike me as the pair that should be sold into. Stochastic is oversold on the daily chart and I would prefer to be neutral or look for bullish reversal signs to open longs at this point in time.
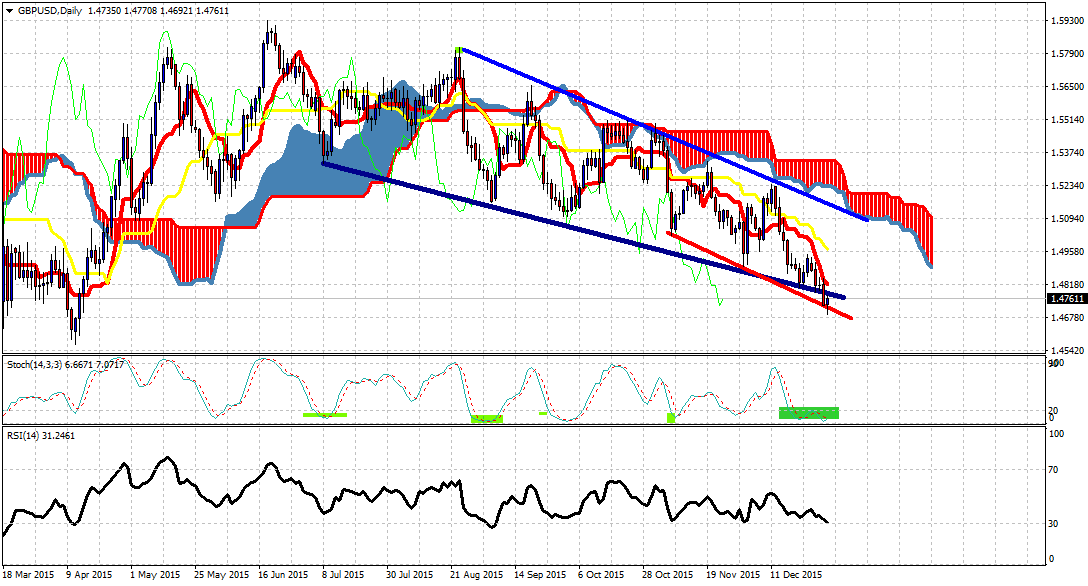
I still believe it is highly probable to see price move back towards the Ichimoku cloud resistance near 1.51, however technically trend remains bearish and only a break and daily close above 1.4840 could change short-term trend to bullish.
The long-term view in this pair is very worrying to me. Triangle patterns is something regularly seen in the pair but this time the break was to the downside.
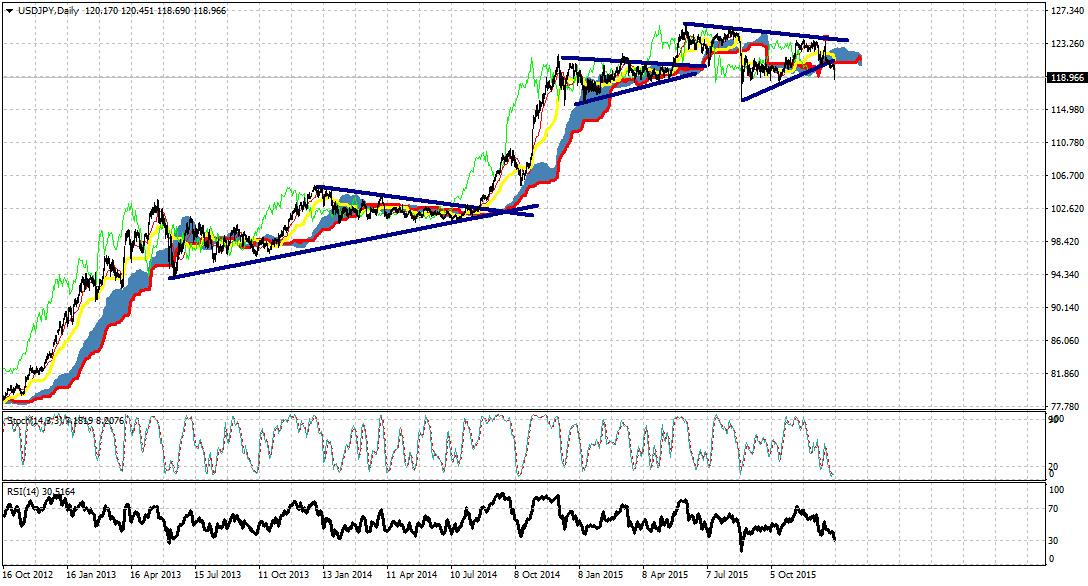
The triangle pattern was broken to the downside and we now see the full effect of this breakdown and bearish signal.
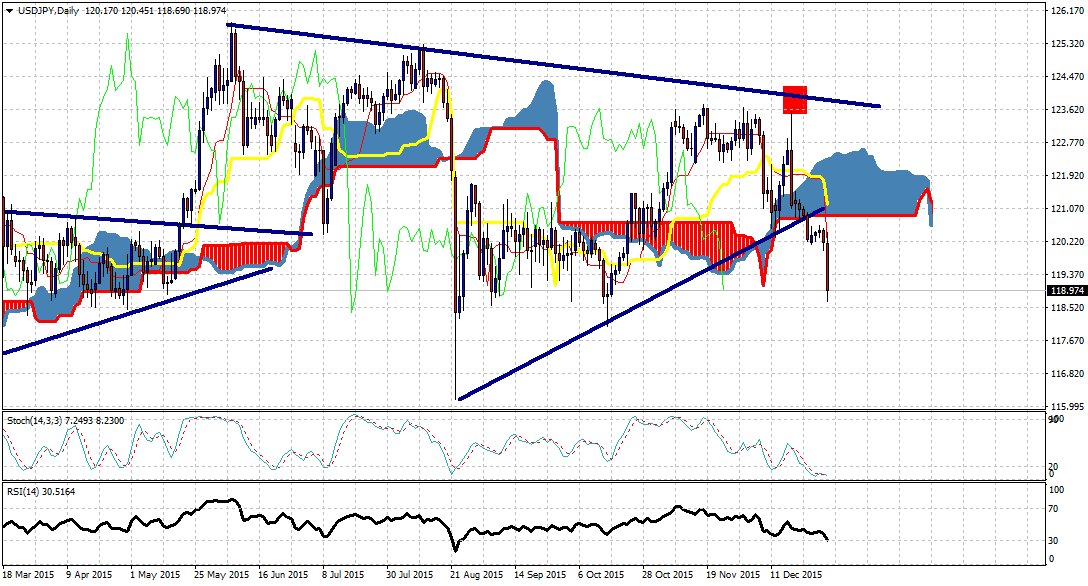
USD/JPY important support is at 116, if lost we are going for a bigger correction to 110. Resistance remains at 123.70.
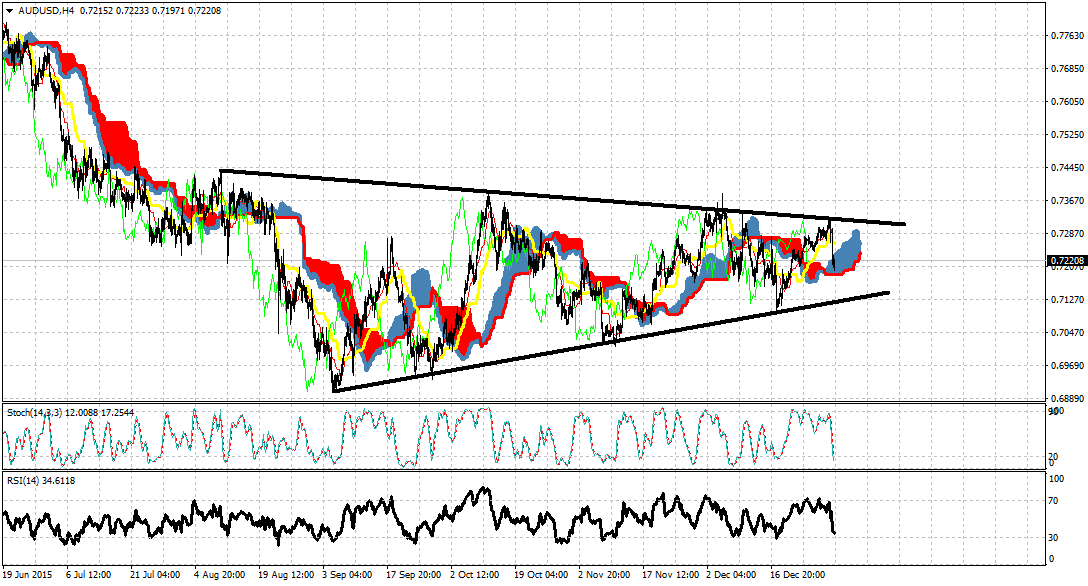
Price has reached the upper triangle boundary and has reversed after being rejected. This pair continues to move sideways inside a tightening range. Traders should prefer to trade only as we approach the boundaries with tight stops, while the real signal will come after the break out of the triangle pattern.
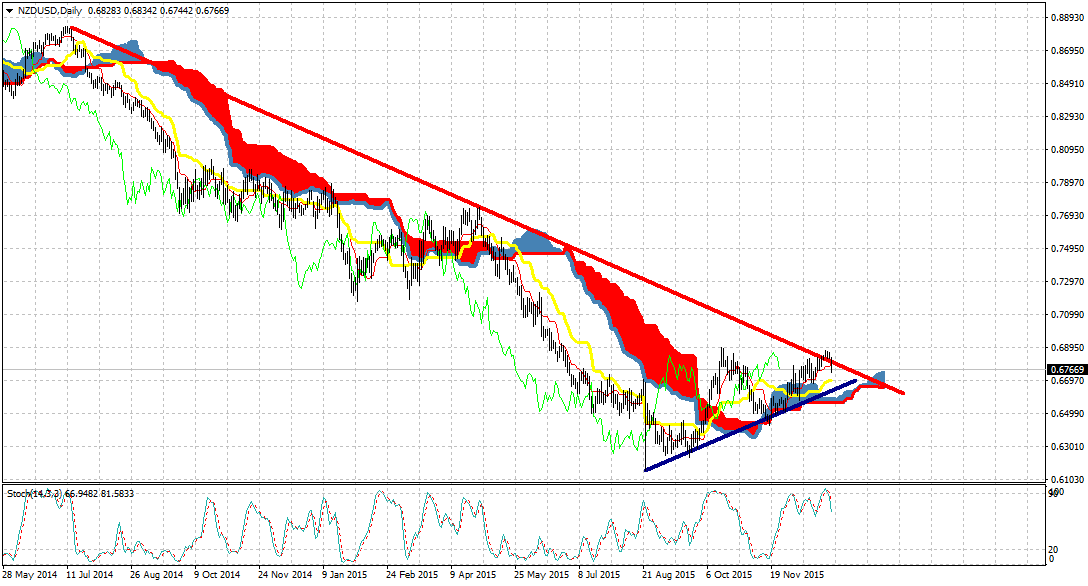
Has it given a false breakout signal above the long-term red downward sloping trend line? I was long into the holiday season but as prices reversed my stop was hit at 0.6820 (spot price). Long-term support is at 0.6650 and I prefer to stay neutral until we reach that area or until we break above 0.6890.
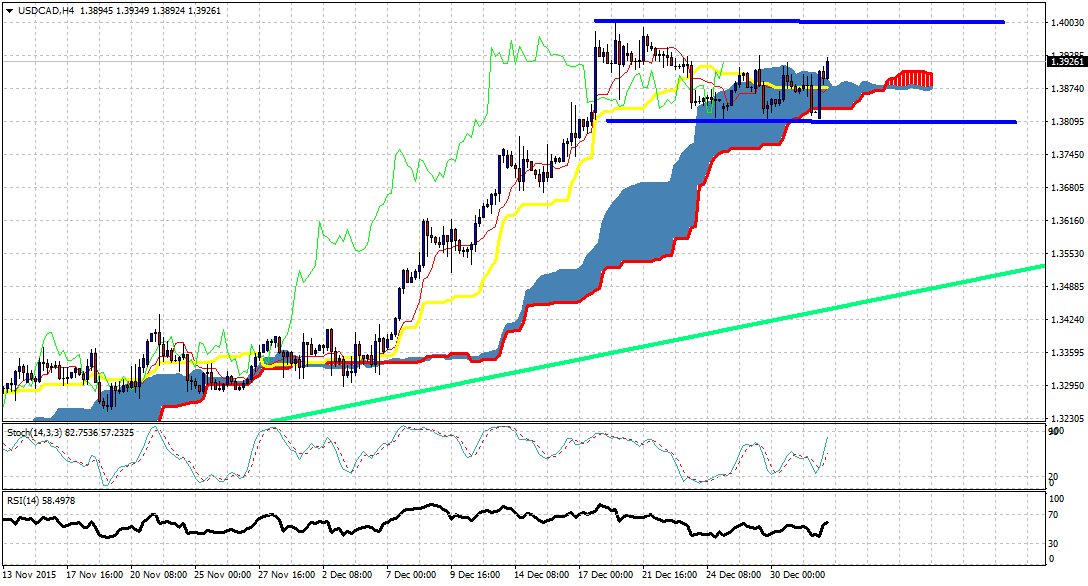
The strong bullish momentum in this pair remains and bulls have not run out of steam yet. Price is mainly moving sideways above support at 1.38. Resistance is at 1.4010.
Remains in a strong down trend despite the recent bounce towards 38$ where prices got rejected once again at important resistance area.
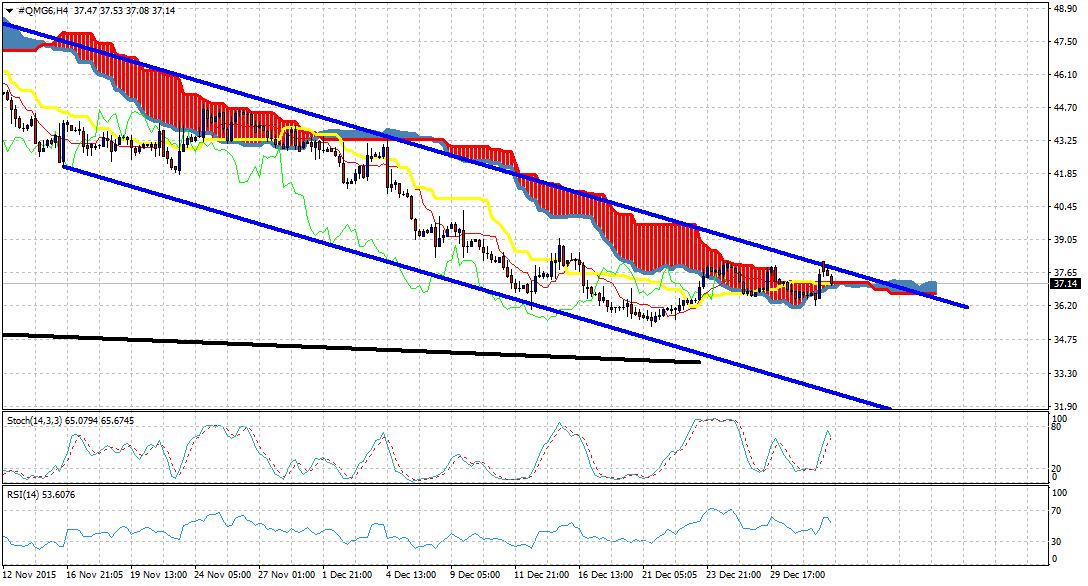
A new move to new lows should not be ruled out specially if 36$ is broken. However my long-term view is contrarian to the bearish consensus for oil prices as I see big upside potential.
Disclosure: None of the information or opinions expressed in this blog constitutes a solicitation for the purchase or sale of any security or other instrument. Nothing in this article constitutes investment advice and any recommendations that may be contained herein have not been based upon a consideration of the investment objectives, financial situation or particular needs of any specific recipient. Any purchase or sale activity in any securities or other instrument should be based upon your own analysis and conclusions.
