Key quotes from the Credit Suisse FX report:
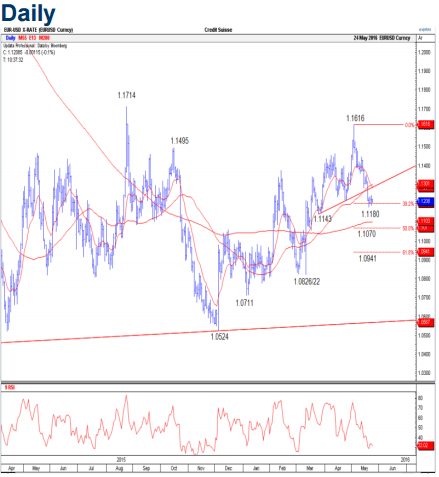
EUR/USD
The immediate risk stays lower for 1.1144, followed by a stronger support at 1.1100/1058. EUR/USD remains in a consolidation range, leaving the immediate outlook unchanged. Whilst still capped beneath trendline resistance and a cluster of moving average now at 1.1284/301, the immediate risk can stay lower for a retest of 1.1180/79 initially, through which can target 1.1144. Beneath the latter is needed to then challenge what should prove to be more solid support at 1.1102/1058 – the 200- day average, 50% retracement level and price support. Resistance shows initially at 1.1244/56, then 1.1297/301. Above the latter is needed to see a recover for 1.1349/59 which we look to cap. Strategy: Short at 1.1199, stop above 1.1256 for 1.1100
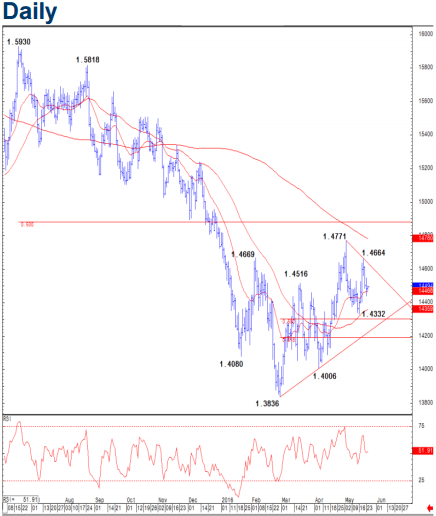
GBP/USD
The focus turns to 1.4403/4396 which we look to ideally hold to maintain the topside bias. GBP/USD has extended its decline, leaving the immediate focus onto price support at 1.4403/4396. Whilst this holds, the immediate risk can stay higher for now towards 1.4549/51 initially, followed by 1.4615/38. Above is needed to target the recent high and 78.6% retracement barrier at 1.4664/77 next. An extension through the latter can then aim at major resistance at 1.4771/80 – the trendline from the 2008 low, the May 2016 high and 200-day average – where we would look for this area to try and cap initially. Below 1.4403/4396 is needed to retest the 55-day average at 1.4359, below which can target key support at 1.4303/4299. Strategy: Long at 1.4480, stop below 1.4403 for 1.4745
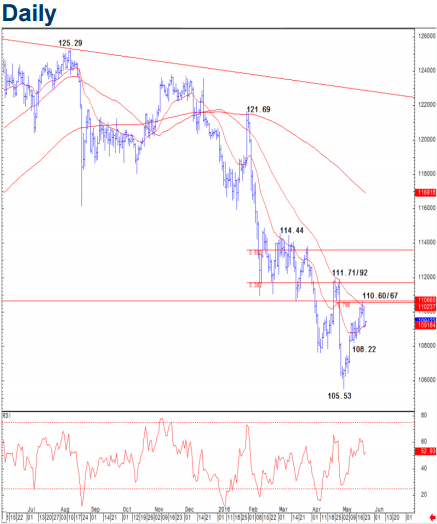
USD/JPY
The focus turns towards price support at 108.72/64. USD/JPY has extended its rejection from price resistance and falling 55-day average now at 110.24/67. This keeps the focus lower for a test of 108.72/64 at fitst, beneath which is needed to turn the risk lower for a more important support at 108.22 where fresh buying is expected to show. A direct capitulation here though can warn of further downside for 107.50/40, followed by 106.43. Immediate resistance moves to 109.68, followed by 109.95. Above 110.24/67 is needed to turn the trend higher for 111.03 initially, ahead of the late April high and 38.2% retracement at 111.71/92. We would look for this zone to ideally cap to maintain the broader downside bias. Strategy: Short at 109.90, stop above 110.70 for 105.90.
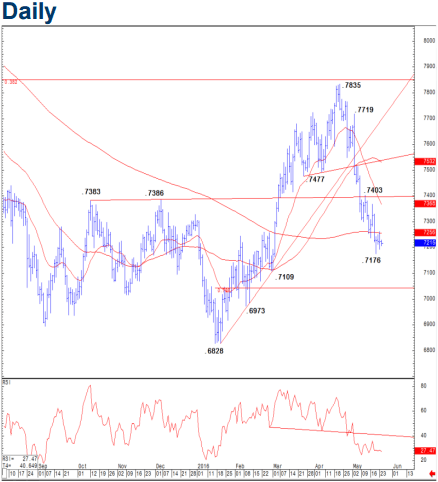
AUD/USD
Below .7176 can reinforce the downside risk for a challenge of the late February lows at .7109. AUD/USD was unable to sustain its early strength and has turned back lower in its range. This keeps the immediate risk lower for a retest of the recent low at .7176 initially, then the late February lows at .7109. We would expect fresh buying to emerge for a bounce here but a direct break lower can suggest more weakness for .7069/64, then .6973. Resistance moves to .7261 at first, above which is needed to see scope for .7299/311 and then .7334. Strategy: Short at .7330, stop above .7405 for .7120.


