The Currency Score analysis is one of the parameters used for the Ranking and Rating list which was published earlier this weekend. Besides this analysis and the corresponding chart I also provide the Forex ranking and rating list.
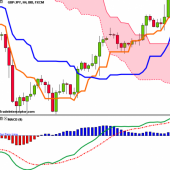
It is recommended to read the page Currency score explained and Models in practice for a better understanding of the article. This article will provide my analysis on the 8 major currencies based on the technical analysis charts using the MACD and Ichimoku indicator on 4 time frames: the monthly, weekly, daily and 4 hours. The result of the technical analysis is the 3 screenshots in this article showing the 13 Weeks Currency Score Data, Currency Score and the Currency deviation table.
Currency Score
For analyzing the best pairs to trade the last 3 months currency classification is the first issue. When looking at the most recent score that is used for the coming period we can see in the screenshot below the deviations and we can draw the first set of conclusions. These are given below the screenshot.

13 Weeks Currency Score Data
The 13 weeks currency score data and the 13 weeks average is provided here below. This data and the "3 months currency classification" are considered for choosing the preferred range.
- At the moment we can see that the CAD has the second lowest value in the 13 weeks average after the EUR. It has been lower than the AUD for 10 out of the last 13 weeks. For that reason the CAD now is a weak currency and the AUD an average currency.
- Same situation applies to the GBP compared to the NZD. In this case the GBP has been lower than the NZD for 9 out of the last 13 weeks. For that reason the GBP now is an average currency and the NZD a strong currency.
Because it is not ideal nor desired to change the range for a currency every single week, we can make several checks to avoid this. First of all the 13 weeks average and the scores over a period of 13 weeks. Both, the average and the scores can be seen in the table below. Besides this the "3 months currency classification" chart of each currency is also consulted. These have been updated and can be found in the following article: Forex Currency Score Classification for Wk1

Last 3 months currency classification
The last 3 months currency classifications from a longer term perspective are provided for reference purposes. The currencies are classified for the coming weeks as follows:

The pair combinations mentioned seem to be the best pairs according to the Currency Score. However, there are some currencies outside their default range. For that reason these currencies are analyzed in more detail in this article.
For choosing the best pairs by simply using the Currency Score it boils down in essence to the 3 following lines of text:
- A strong currency can be traded long against all the other currencies except on a pullback(deviation) then it seems best to trade it only against a weak currency.
- A weak currency can be traded short against all the other currencies except on a pullback(deviation) then it seems best to trade it only against a strong currency.
- When an average currency is outside the range(deviation) it is best not to trade it against similar currencies in the average range and the currencies in the range it is at.
Because the text above is quite abstract you can read below a more detailed description. At the same time we will look into the interesting pairs mentioned in the Ranking and Rating list already published this weekend, the group pair combination is added behind the pair:
- GBP/NZD (S/W) with the EUR/JPY (A/W)
- CAD/JPY (A/W) with the EUR/NZD (S/W)
- NZD/CAD (S/W) with the EUR/JPY (A/W)
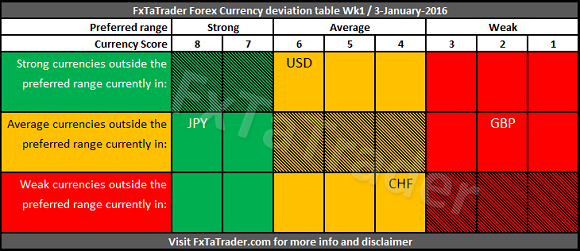
The Forex Currency deviation table shows the deviations and the ranges where the deviating currencies should be in. Any strong or weak currency outside the range are most probably in a pullback and loosing momentum.
- These currencies can best be traded according to the combinations in the group "S/W" in the Forex Group pair combinations table.
- All the other strong currencies can be traded according to the combinations in the group "S/A" and "S/W" in the Forex Group pair combinations table.
- All the other weak currencies can be traded according to the combinations in the group "A/W" and "S/W" in the Forex Group pair combinations table.
Any average currency outside the range are getting stronger if they are in the "Strong" range or weaker if they are in the "Weak" range. These currencies can best be traded with the opposite range.
- An average currency in the "Strong" range can best be traded against a weak currency, see the the combinations in the group "A/W".
- An average currency in the "Weak" range can best be traded against a strong currency, see the the combinations in the group "S/A".
- All the other average currencies can be traded according to the combinations in the group "S/A" and "A/W" in the Forex Group pair combinations table.
A good foundation is provided for looking at the Weekly and Daily Technical analysis chart of a specific pair by using the (1)"Ranking and Rating list", published earlier this weekend, with the above (2)"Weekly Currency Score" analysis and together with the (3)"Currency score difference" table with the (4)"Top Forex pairs table" where the Bollinger Bands analyses are made on the interesting pairs.
- The analyses are complementary where:
- the "Ranking and Rating list" takes strength, direction and volatility into account.
- the "Currency score" looks for the strong trends and pullbacks with a possible disadvantage of being overbought/oversold.
- the "Currency score difference" adds granularity to the "Currency score" by using the score difference for determining potential trends.
- the "Bollinger Band®" confirms that a potential trend found is not being overbought/oversold.
- With the "Currency score difference" and the "Bollinger Band" the disadvantage mentioned for the Currency score will be avoided.
When trading according to the FxTaTrader Strategy some rules are in place. For more information see the page on my blog FxTaTrader Strategy. Depending on the opportunities that may come up the decision to trade a currency may become more obvious at that moment. If you would like to use this article then mention the source by providing the URL FxTaTrader.com or the direct link to this article. Good luck in the coming week.
DISCLAIMER: The articles are my personal opinion, not recommendations, FX trading is risky and not suitable for everyone.The content is for educational purposes only and is aimed solely for the use by ‘experienced’ traders in the FOREX market as the contents are intended to be understood by professional users who are fully aware of the inherent risks in forex trading. The content is for 'Forex Trading Journal' purpose only. Nothing should be construed as recommendation to purchase any financial instruments.