Get 40% Off
🚨 Volatile Markets? Find Hidden Gems for Serious Outperformance
Find Stocks Now

Forecasting The S&P 500 E-mini Futures Index...My Dumb Luck?

Published 03/29/2015, 11:59 PM
Updated 07/09/2023, 06:31 AM

My post of April 5, 2014 refers to the below.

The following Daily chart of the {{8839|ES S&P 500 E-Mini Futurs Index}} shows what happened from that date up to the present. The ensuing swings overshot my projected targets a bit, and it took a bit longer for the "FROTH" level around 2100 to be reached, but price action generally followed the path that I forecast a year ago...price has been consolidating, basically, below that level since December 2014. Additionally, volatility did become the "name of the game" over those weeks and months, as I had anticipated.
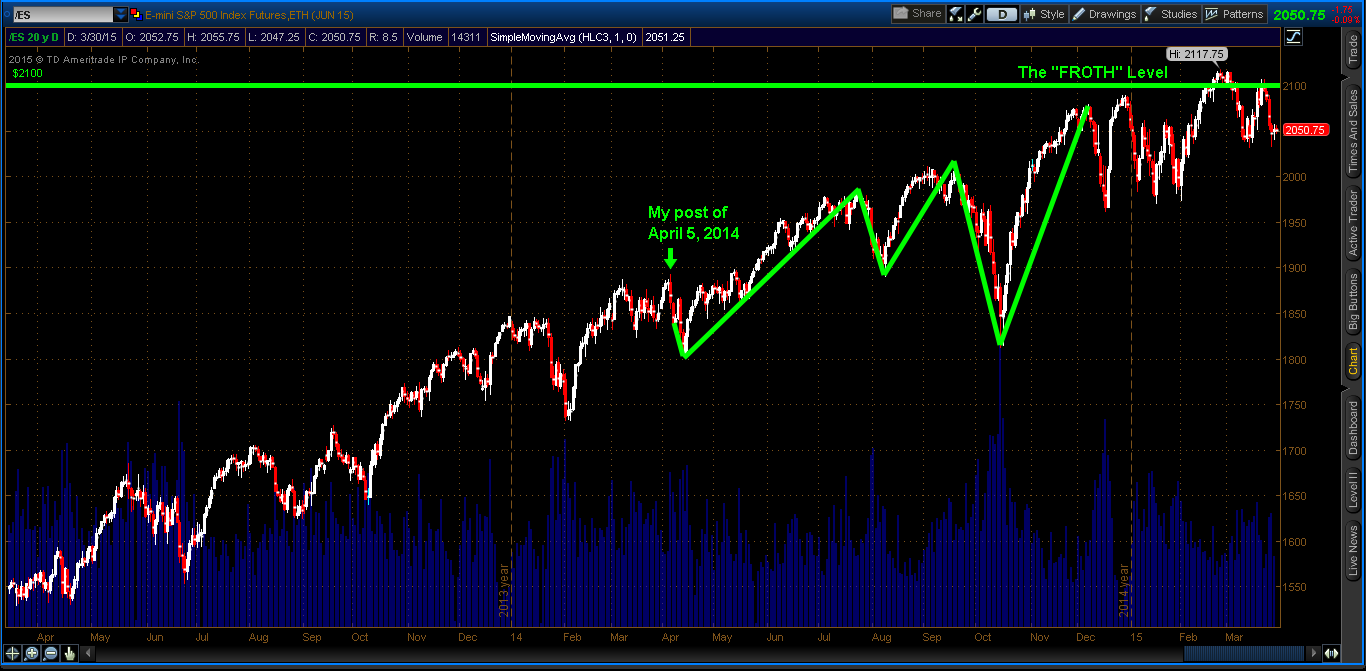
ES Daily Chart 2014-2015
As can be seen on the next Daily chart of the ES, 2100 represents a double Fibonacci confluence major resistance level that will have to be solidly overcome and held before bulls can resume any kind of sustainable uptrend. A break and hold below 1992 could see bears take the ES down to 1813, or lower. Until we see a solid break one way or the other, I expect volatile swings to continue in both directions to plague both the bulls and the bears.
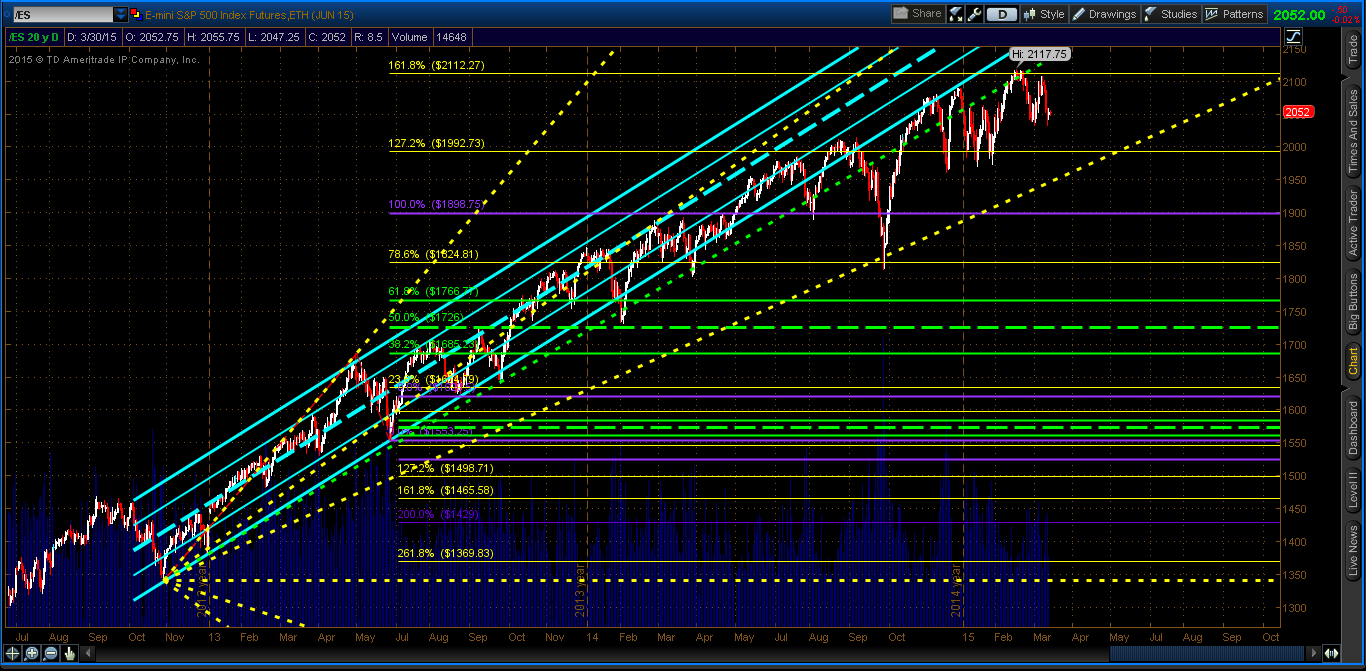
ES Daily 2013-Present

Latest comments

Risk Disclosure: Trading in financial instruments and/or cryptocurrencies involves high risks including the risk of losing some, or all, of your investment amount, and may not be suitable for all investors. Prices of cryptocurrencies are extremely volatile and may be affected by external factors such as financial, regulatory or political events. Trading on margin increases the financial risks.
Before deciding to trade in financial instrument or cryptocurrencies you should be fully informed of the risks and costs associated with trading the financial markets, carefully consider your investment objectives, level of experience, and risk appetite, and seek professional advice where needed.
Fusion Media would like to remind you that the data contained in this website is not necessarily real-time nor accurate. The data and prices on the website are not necessarily provided by any market or exchange, but may be provided by market makers, and so prices may not be accurate and may differ from the actual price at any given market, meaning prices are indicative and not appropriate for trading purposes. Fusion Media and any provider of the data contained in this website will not accept liability for any loss or damage as a result of your trading, or your reliance on the information contained within this website.
It is prohibited to use, store, reproduce, display, modify, transmit or distribute the data contained in this website without the explicit prior written permission of Fusion Media and/or the data provider. All intellectual property rights are reserved by the providers and/or the exchange providing the data contained in this website.
Fusion Media may be compensated by the advertisers that appear on the website, based on your interaction with the advertisements or advertisers.
© 2007-2024 - Fusion Media Limited. All Rights Reserved.