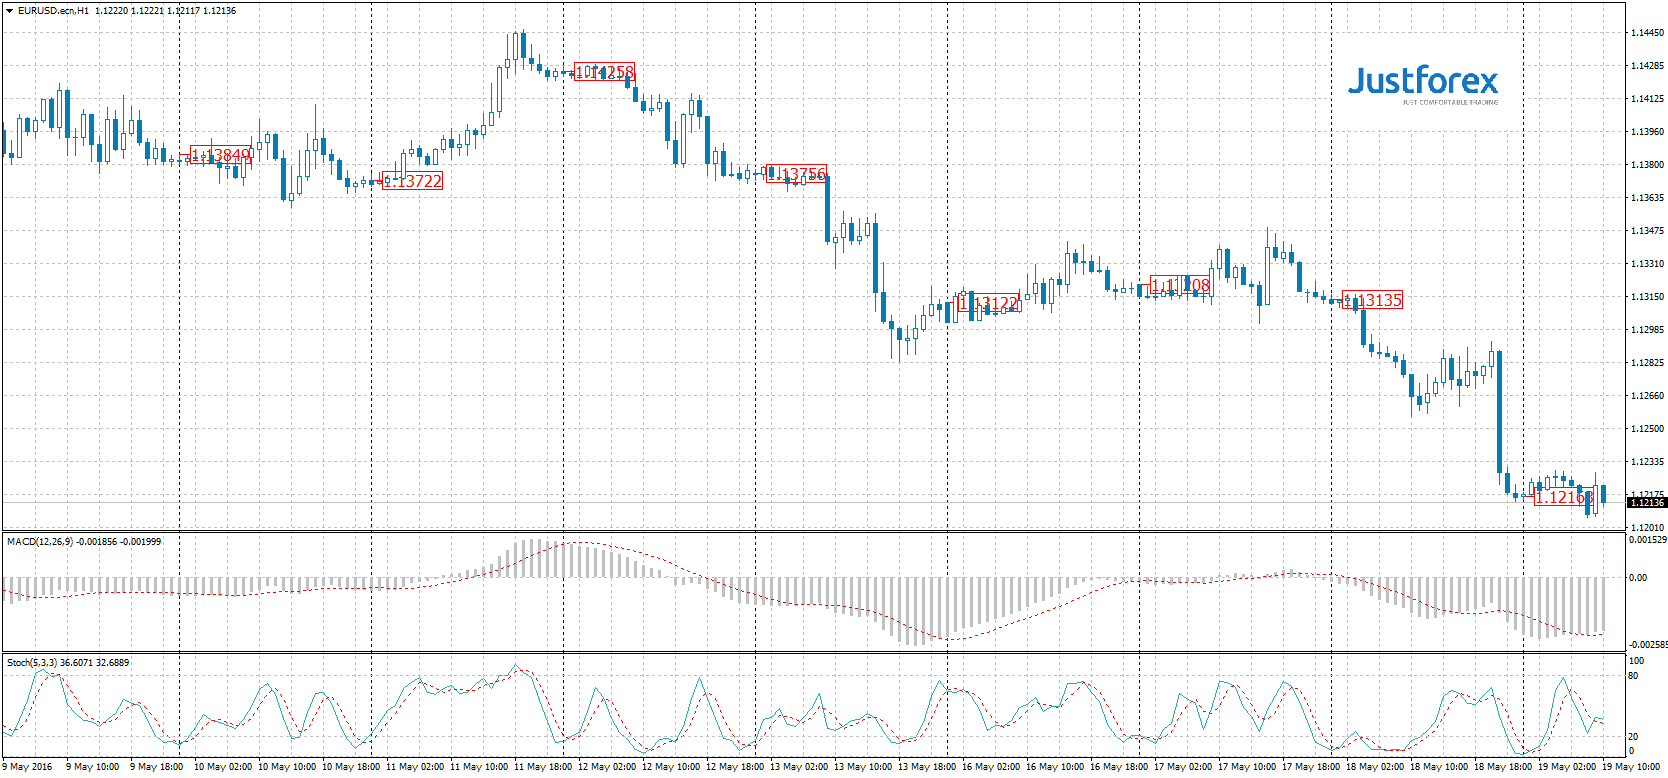
Yesterday's trading was in favor of the American currency strengthening. In particular, it was strongly influenced by the publication of FOMC protocols at 21:00, which reduced the price of EUR/USD by more than 70 pips.
The MACD histogram is in the negative zone above its signal line, which can be regarded as a signal to buy EUR/USD.
The stochastics oscillator is in the neutral zone and the %K line is above the %D line, sending the signal to buy EUR/USD.
At 15:30 (GMT +2: 00) the index of manufacturing activity from the Federal Reserve Bank of Philadelphia will be released.
We can see in the graph that the price of EUR/USD reached the strong support level of 1.12175, and there is a possibility that EUR/USD growth to the level of 1.12600 could be resumed. In case of a positive news release, the price of EUR/USD may continue to decline and reach the level of 1.11500.
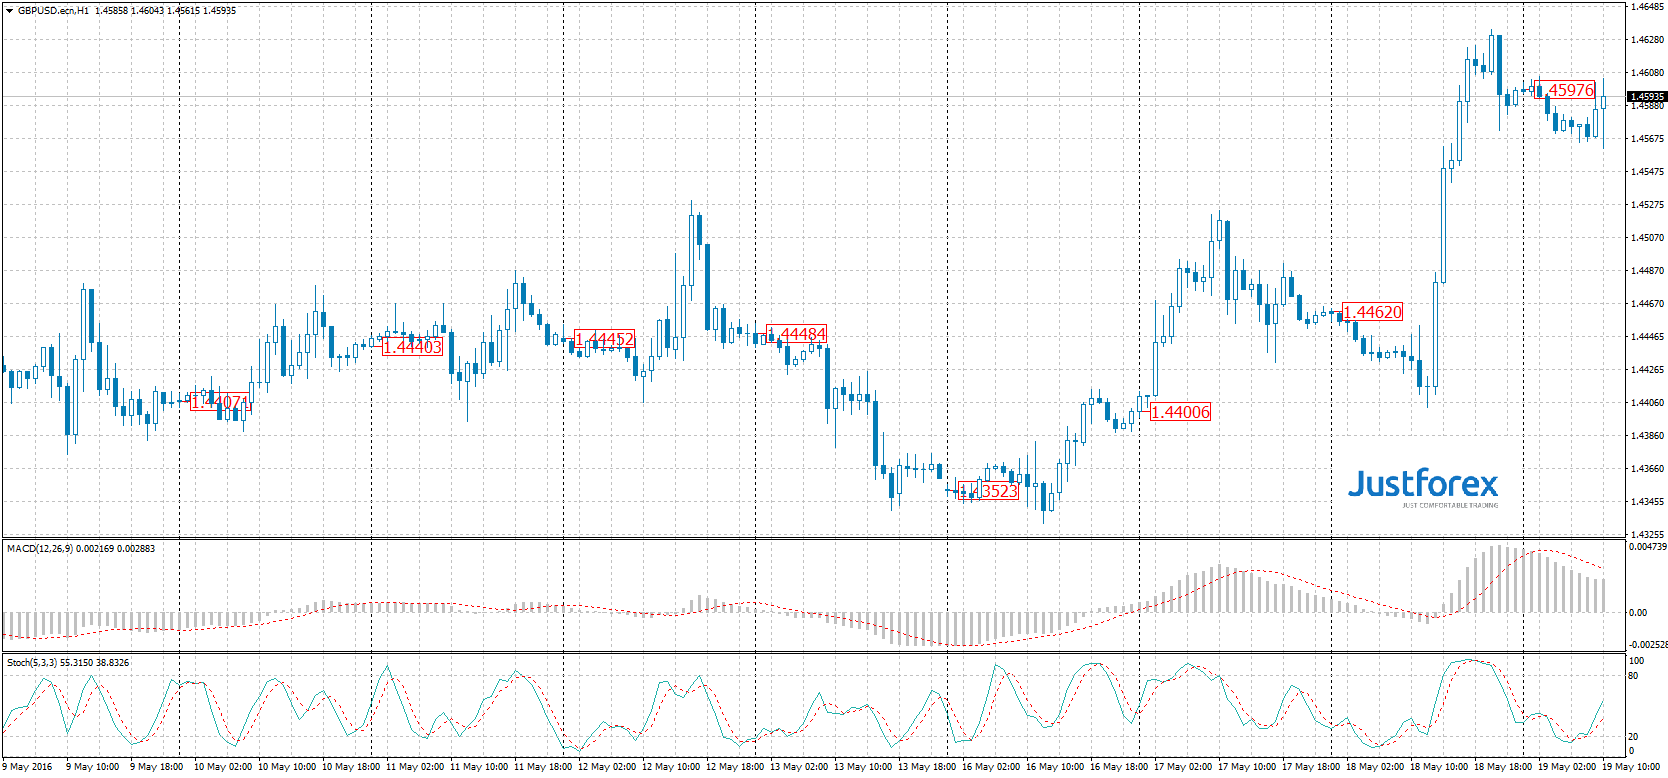
This currency pair observed growth of more than 230 pips, with the price reaching the level of 1.46340. The positive news released in the UK could be the reason of such rapid growth.
The MACD histogram is in the positive zone, below its signal line, which can be regarded as a signal to sell GBP/USD.
The stochastics oscillator is in the neutral zone and the %K line is above the %D line, sending the signal to buy GBP/USD.
Today at 11:30 news regarding UK retail sales will be released again. There is a high probability that results will be positive and the GBP/USD price may continue to rise to the level of 1.46500.
Otherwise, GBP/USD price could drop to the level of 1.45000.
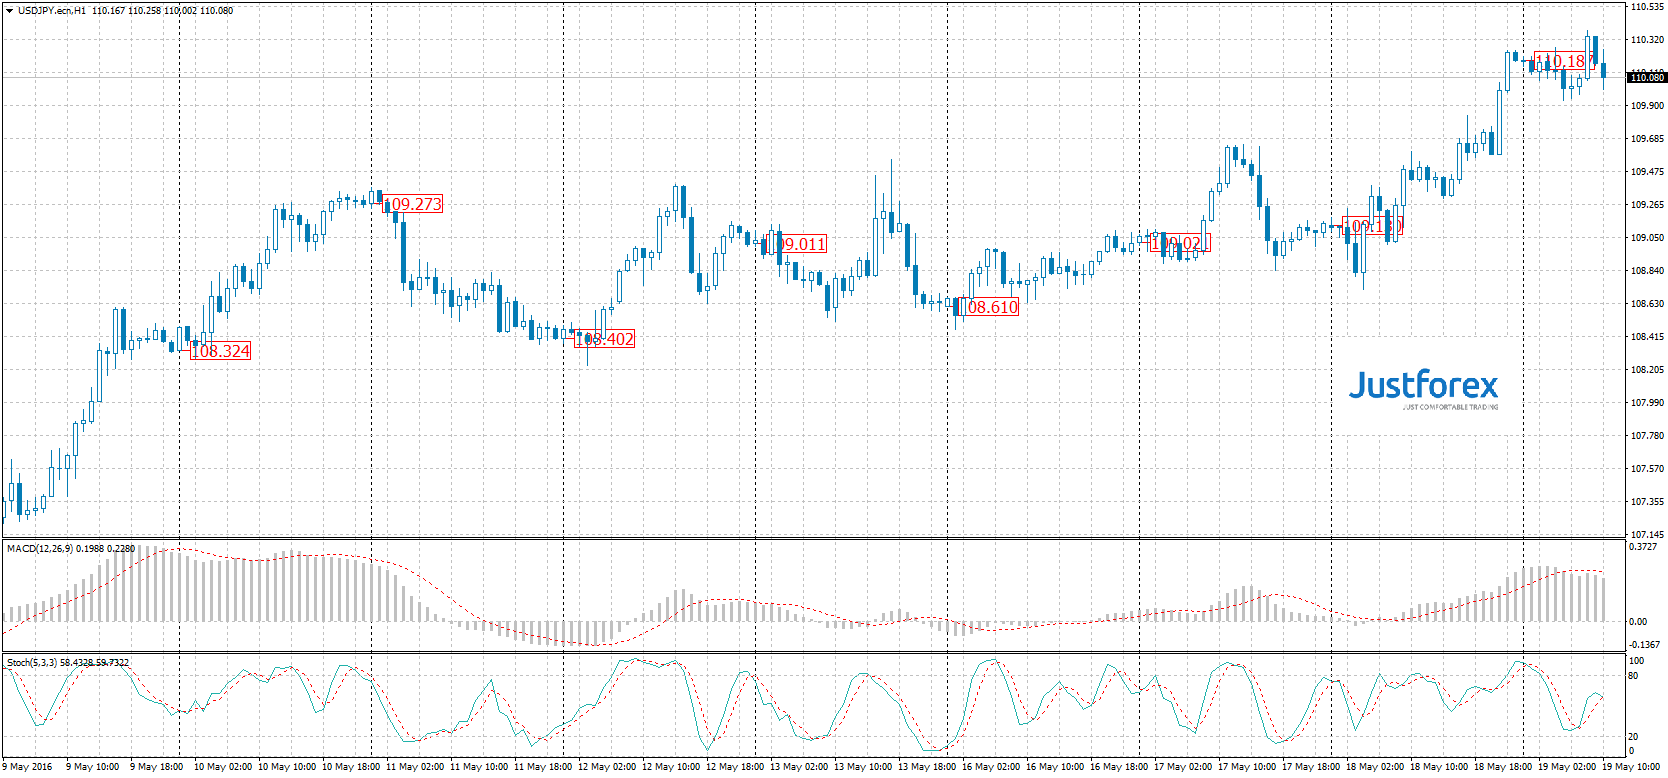
On the USD/JPY hourly graph we see that yesterday the pair was under the influence of bulls all day, as the price of USD/JPY rose for more than 150 pips and still reached the level of 110.000.
The MACD histogram is in the positive zone, below its signal line, which can be regarded as a signal to sell USD/JPY.
The stochastic oscillator is in the neutral zone and the %K is below the %D line, sending the same signal to sell USD/JPY.
We assume that growth of USD/JPY to the level of 110.600 could be the main scenario today. An alternative is reduction of price to the level of 109.700.
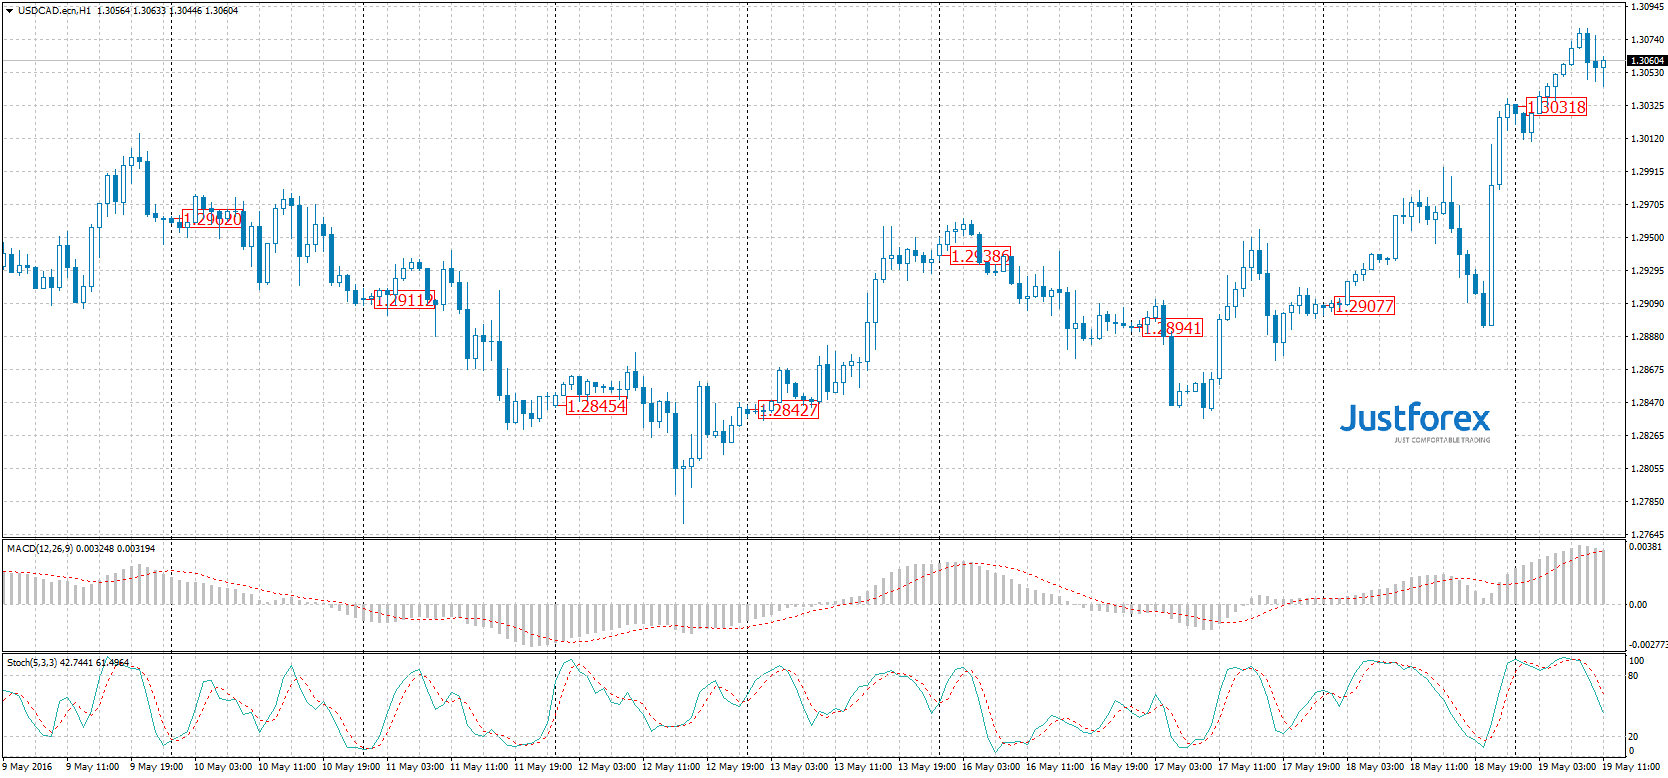
Yesterday's CAD trading was very volatile. In one day the USD/CAD price rose for more than 120 points and broke through the level of 1.30000, thus fully confirming our forecast.
The MACD histogram is in the positive zone, above its signal line, which can be regarded as a signal to buy USD/CAD.
The stochastic oscillator is in the neutral zone and the %K line is below the %D, which indicates a possible signal to sell USD/CAD.
We believe that the price of USD/CAD could continue to rise to the level of 1.13100 today.
