KEY DATA RELEASES TODAY:
0930GMT GBP Unemployment Rate exp 5.9% v 6.0%
0930GMT GBP Claimant Count Change exp -19.8K v -20.4K
0930GMT GBP Average Earnings Index 3m/y exp 1.3% v 1.0%
0930GMT GBP MPC Official Bank Rate Votes exp 2-0-7 v 2-0-7
0930GMT GBP MPC Asset Purchase Facility Votes exp 0-0-9 v 0-0-9
1000GMT EUR Final CPI y/y exp 0.3% v 0.3%
1330GMT USD Current Account exp -98B v-99B
1330GMT USD CPI m/m exp -0.1% v0.0%
1330GMT USD Core CPI m/m exp 0.1% v 0.2%
1900GMT USD FOMC Economic Projections
1900GMT USD FOMC Statement
1900GMT USD Federal Funds Rate exp 0.25% v 0.25%
1930GMT USD FOMC Press Conference
OVERNIGHT:
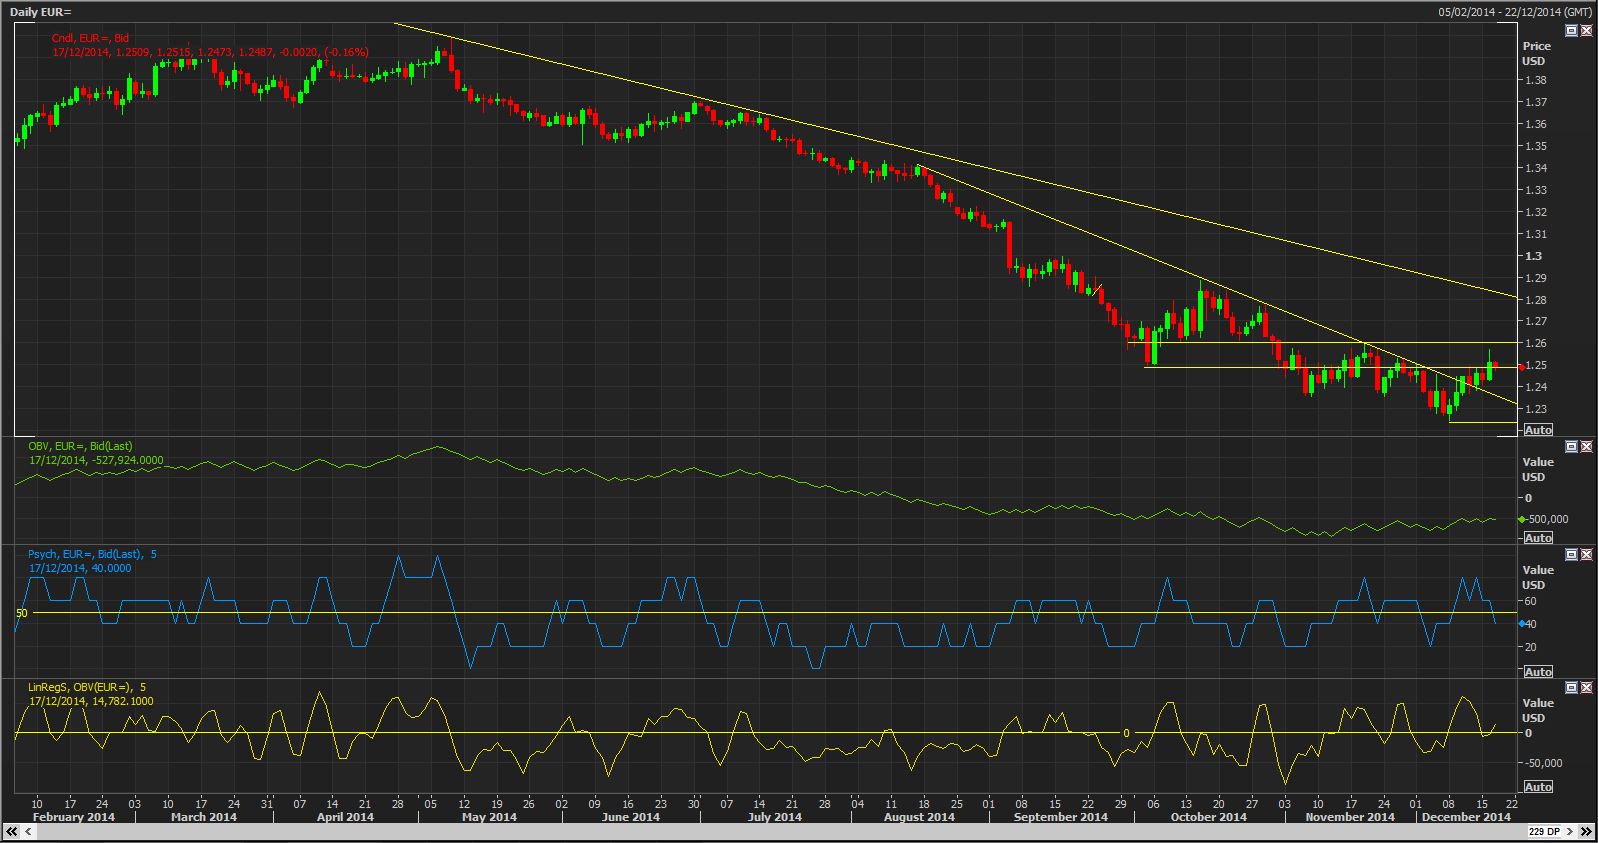
EUR/USD edged higher yesterday and broke resistance at 1.2500 after the release of Eurozone December PMI data. The manufacturing PMI printed at 50.8 vs. 50.5 exp, while service PMI was 51.0 vs. 51.5 exp. EUR/USD posted a high of 1.2569 upon the better than expected Zew data, the expectations index improved further to 34.9 vs. 20.0 exp. EUR/USD has pulled back overnight as postions are squared ahead of the FOMC today.
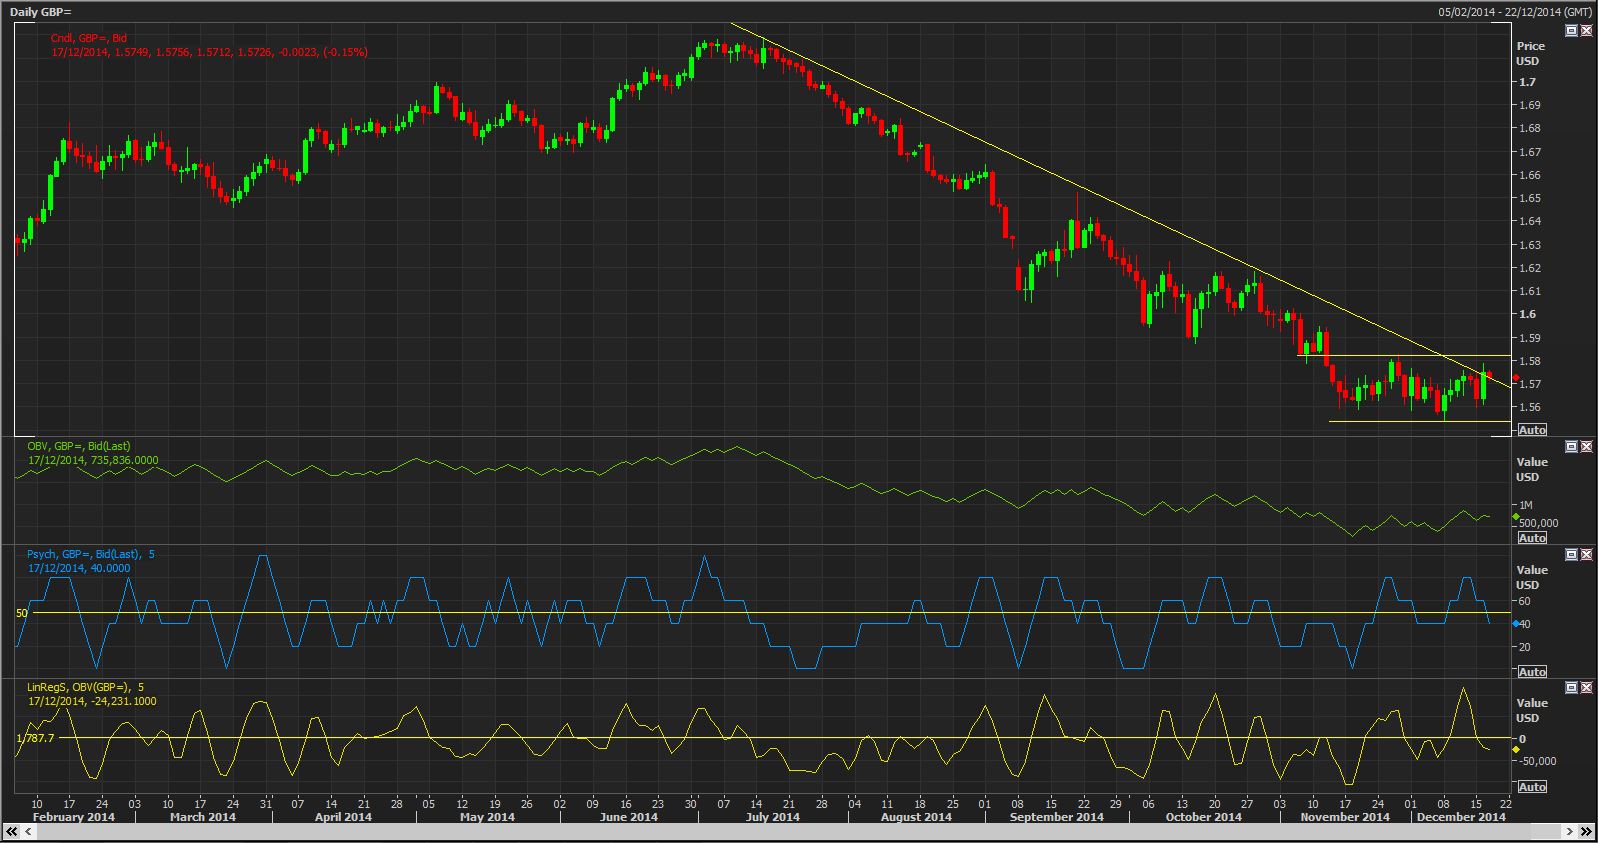
UK CPI rose by an annual 1.0 percent in November, compared with 1.3 percent in October, while British inflation fell to its lowest level in more than 12 years in November. This further eased the squeeze on consumers and left the Bank of England under no pressure to raise interest rates. GBP/USD got a boost and squeezed above 1.5700 and reaching an intraday high at 1.5785.
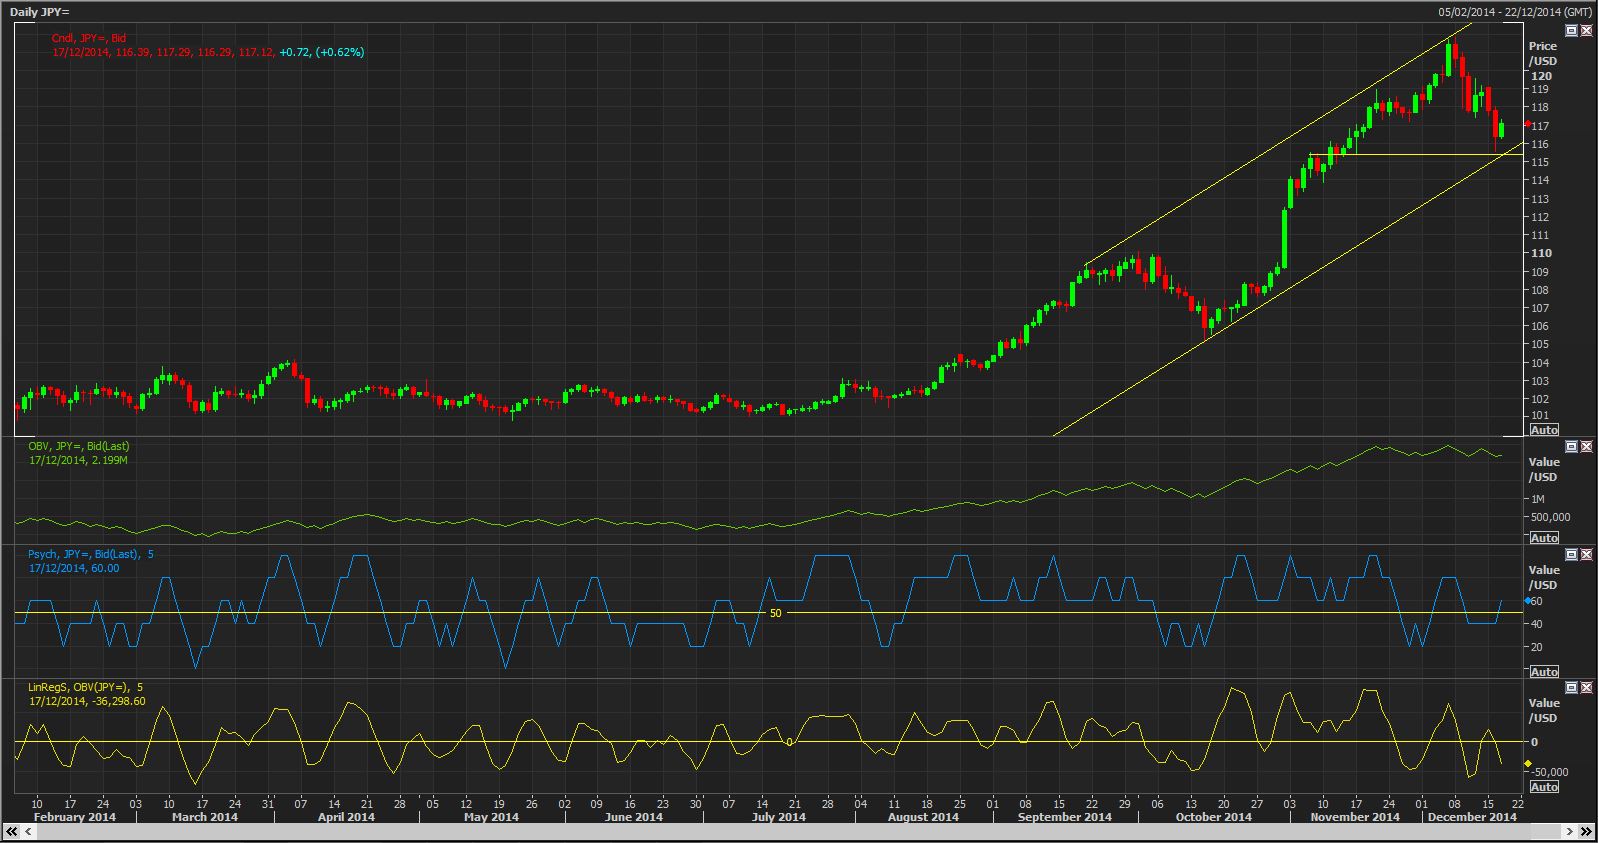
USD/JPY plunged to a 1-month low from yesterdays high of 118.01 to a low of 115.56 while investors show concerns about global growth. A slip in the Markit/HSBC Chinese manufacturing PMI for December was a risk-off driver yesterday and JPY flowed on the back of a safe haven buying. Investors will now focus on the FOMC today watching for signals about the central banks timeline for raising interest rate.
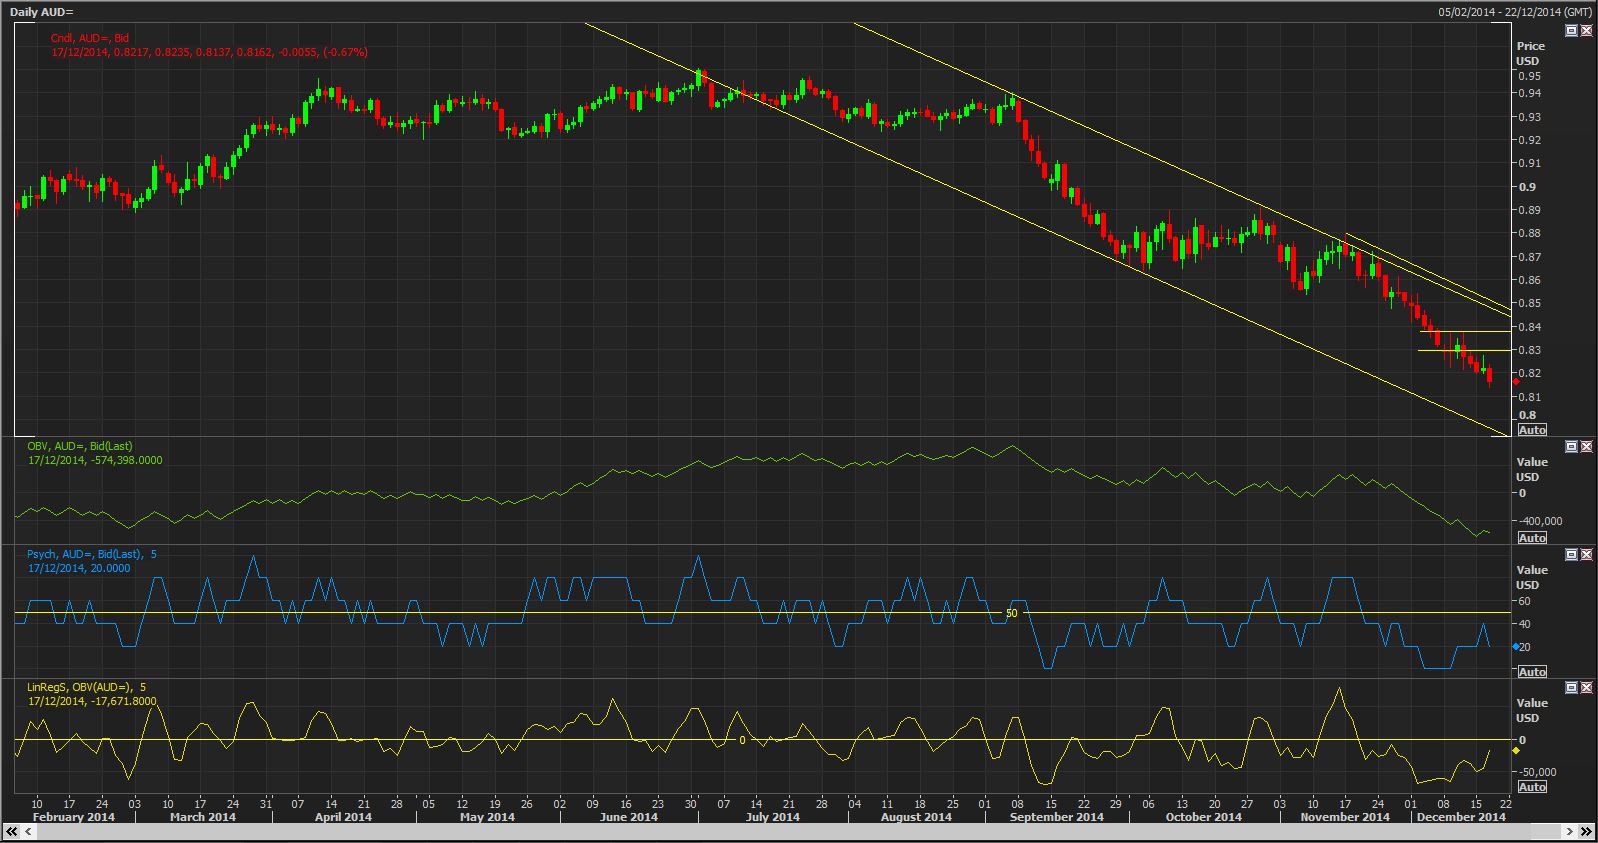
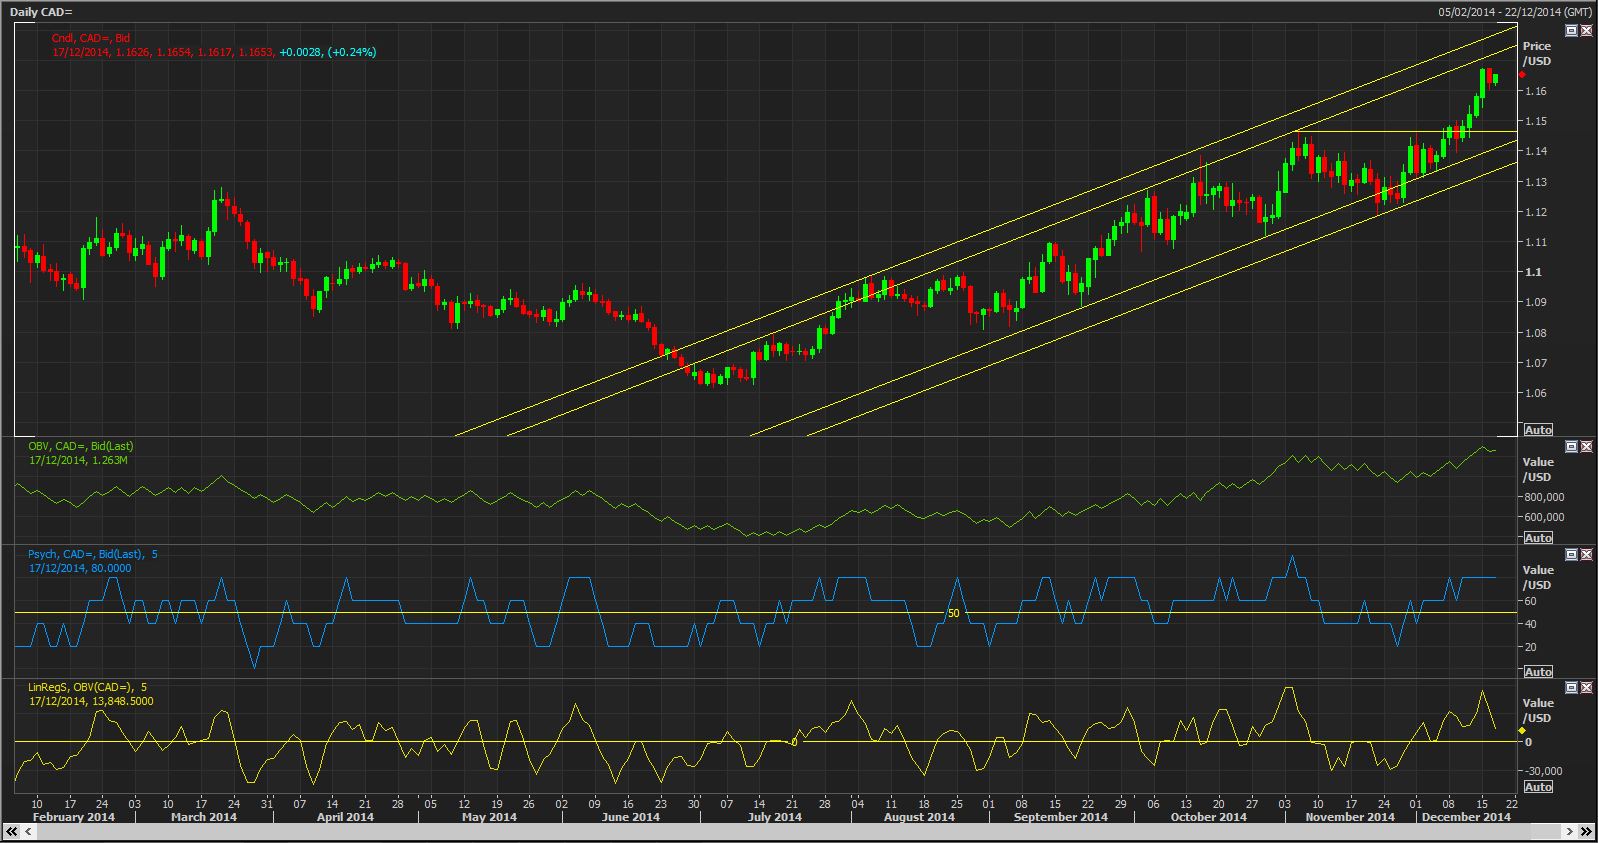
Elsewhere Activity in China’s factory sector contracted this month for the first time in seven months and the weak economic indicators added to concerns about oil demand from the world’s second-largest oil consumer, weighing on the AUD/USD at multi year lows and supporting the USD/CAD at multi year highs.
Looking ahead this morning we the Bank of England minutes ahead of US CPI and the much anticipated FOMC rate decision and press conference with Fed Chair Yellen.
OVERNIGHT PRICE ACTION:
EUR: Breaks 1.25 stiffer test at 1.26 eyed
GBP: Trend line and 2 month range resistance challenged
JPY: Channel support to be tested
CAD: 5 year highs, consolidation continues
AUD: New multi year lows, 0.80 eyed
KEY TRADES:
| FX Pair | Short Term | Position/Date | Entry Level | Target | Stop | Comments |
| EUR/USD | Bullish | BUY 13 DEC | 1.2495 | OPEN | 1.2345 | |
| GBP/USD | Neutral | Await new signal | ||||
| USD/JPY | Neutral | Await new signal | ||||
| USD/CAD | Bullish | BUY 9th DEC | 1.1495 | 1.1695 | 1.1545 | Risk Free |
| AUD/USD | Bearish | Await new signal |
ANALYSIS:
EUR/USD Short Term (1-3 Days): Bullish – Medium Term (1-3 Weeks) Bearish
- Breaks 1.25 now eyeing stiffer test at 1.26 before trendline resistance above at 1.28
- Order Flow indicators; OBV consolidating, Linear Regression supported at midpoint and Psychology pierces midpoint form above
- Watching price action to reset long positions
GBP/USD: Short Term (1-3 Days): Neutral – Medium Term (1-3 Weeks) Bearish
- Trend line resistance eroding, 2 month range resistance eyed
- Order Flow indicators; OBV consolidating, Linear Regression and Psychology pierce midpoints from above
- Watching trendline/range resistance break and retest for new positions
USD/JPY: Short Term (1-3 Days): Neutral – Medium Term (1-3 Weeks) Bullish
- Trend channel support being tested
- Order Flow indicators; OBV consolidating at highs, Linear Regression rotating at midpoint and Psychology piercing midpoint from below
- Monitoring price action at trend channel support for potential new long positions
USD/CAD: Short Term (1-3 Days): Bullish - Medium Term (1-3 Weeks) Bullish
- Topside of projected trend channel near term upside objective
- Daily Order Flow indicators; OBV consolidating at highs, Linear Regression to retest midpoint from above and Psychology bullish
- Target and stops amended, please see key trades
AUD/USD: Short Term (1-3 Days): Bearish - Medium Term (1-3 Weeks) Bearish
- New multi year lows printed overnight, 0.80 level eyed, then downside trend channel support below
- Order Flow indicators; OBV consolidating at depressed levels, Linear Regression ticking up to test midpoint from below and Psychology rejected at midpoint
- Monitoring trendline resistance and previous spike lows to set new shorts
