Forex News and Events:
The risk sentiment turns mild on mounting tensions in Iraq. The soft commodities, oil and precious metals open the week in the green, the EM currencies are sold against USD this Monday with Turkish lira recording the heaviest session losses at the time of writing. The CBT Governor Basci gave signs of hawkishness regarding next week policy meeting (despite political pressures in favor of lower rates), slightly easing the morning tensions on the lira. In UK, the pound rallied to fresh highs versus EUR and USD. Technicals ring the “overbought” alarm.
GBP technicals ring the “overbought” alarm
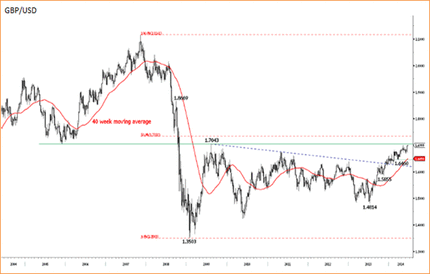
The Cable shortly spiked to 1.7011 in Europe open, after the BoE Governor Deputy Bean stated that higher rates should be welcomed as sign of economy returning to normal. The UK sovereign curve steepened: the 2-yr yields spiked to three-year high, the 10-yr yields advanced to two-month highs. GBP-complex comes under decent buying pressure on the back of BoE officials’ comments hinting on earlier rate hikes. Although the bullish trend gains momentum, the Cable nears the overbought conditions: the RSI at 67%, the 30-day BB at 1.6989. We expect corrective offers to fight back the Cable strength below 1.7043 (five year high) as the markets absorb the rising GBP demand.
Versus the EUR, the RSI points deeply over bought GBP suggesting a short-term upside correction is now technically urging. The 30-day RSI on EUR/GBP stands at 18%, a technical picture last seen on May 2012 on heavy political tensions in the Euro-zone. (Quick historical reminder: in Greece, two pro-bailout parties had failed to win the elections, in France François Hollande had defeated his pro-European opponent Nicolas Sarkozy). At that time, after short-term correction the EUR/GBP bears have gained significant momentum on the downside hitting 0.77552 (lowest EUR/GBP spot since October 2008). Given the divergence between the BoE/ECB policy outlooks, similar path is eyed in EUR/GBP direction. The 1-month forward points step up to eight month highs suggesting that relatively cheap euros find buyers, while EUR/GBP 1-month risk reversals grind lower as lower strikes jump in.
“CBT is not an institution of tutelage”, Basci says
Turkish lira sold-off aggressively as tensions escalate at its Eastern border. In addition, (again) a teenager has been shot in the head during protests in the Southern city of Adana, the political tensions between anti- and pro-government citizens remain tight walking into presidential elections. In this risk environment, the Turkey Central Bank Governor Basci is clearly facing hard times. The rising inflationary pressures on one side, heavy pressures on lower rates from the ruling AKP government on the other, Basci saw his CBT officials replaced over the past week. We keep our cautious stand versus TRY and TRY holdings, given CBT’s limited flexibility (and questionable independence) to manage volatilities. In his speech in Konya today, the Governor Basci said that the CBT needs to persuade the markets that the inflation will fall for rates to fall, adding that the rates will be raised if needed for stability. Basci added that the weak lira accounts for 3 points of Turkey’s inflation rate, that the inflation should be brought down to 5% before his term expires next year and that the rate cuts may continue as inflation outlook recovers (in our interpretation, Turkey is yet not there with year-on-year inflation figures approaching 10%). Basci added that the CBT is not an institution of tutelage.
The CBT will announce verdict on June 24th. Given the selling pressures on lira, rising TRY volatilities and strong inflationary dynamics, we believe that the policy rates should be corrected on the upside while stressing that the markets price in a measured rate cut out of next week MPC meeting.

Today's Key Issues (time in GMT):
2014-06-16T12:30:00 CAD Apr Int'l Securities Transactions, last -1.23B2014-06-16T12:30:00 USD Jun Empire Manufacturing, exp 15, last 19.01
2014-06-16T13:00:00 CAD May Existing Home Sales MoM, last 2.70%
2014-06-16T13:00:00 USD Apr Net Long-term TIC Flows, exp $30.0B, last $4.0B
2014-06-16T13:00:00 USD Apr Total Net TIC Flows, last -$126.1B
2014-06-16T13:15:00 USD May Industrial Production MoM, exp 0.50%, last -0.60%
2014-06-16T13:15:00 USD May Capacity Utilization, exp 78.90%, last 78.60%
2014-06-16T13:15:00 USD May Manufacturing (SIC) Production, exp 0.60%, last -0.40%
2014-06-16T14:00:00 USD Jun NAHB Housing Market Index, exp 47, last 45
The Risk Today:
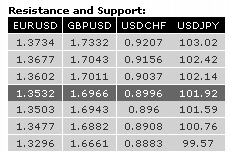
EUR/USD's bullish intraday reversal on 5 June has created a key support at 1.3503. Monitor the current consolidation phase. The inability thus far to break the hourly resistance at 1.3602 (10/06/2014 high) favours a bearish bias. Another resistance stands at 1.3677. In the longer term, the break of the long-term rising wedge (see also the support at 1.3673) indicates a clear deterioration of the technical structure. The long-term downside risk implied by the double-top formation is 1.3379. Key supports can be found at 1.3477 (03/02/2014 low) and 1.3296 (07/11/2013 low).
GBP/USD is challenging the major resistance at 1.7043 (05/08/2009 high). The short-term bullish momentum is intact as long as the initial support at 1.6943 (intraday low) holds. Another support can be found at 1.6882 (27/05/2014 high). In the longer term, a medium-term bullish bias is favoured as long as the support at 1.6661 (15/04/2014 low) holds. The persistent buying interest favours an eventual break of the major resistance at 1.7043 (05/08/2009 high). Other resistances can be found at 1.7332 (see the 50% retracement of the 2008 decline) and 1.7447 (11/09/2008 low).
USD/JPY is trying to bounce near the support implied by the 200 day moving average (around 101.59). A break of the hourly resistance at 102.14 (12/06/2014 low) is needed to negate the current short-term bearish trend. Another hourly resistance lies at 102.42 (intraday high). Another support stands at 101.43 (29/05/2014 low). A long-term bullish bias is favoured as long as the key support 99.57 (19/11/2013 low) holds. Monitor the support area provided by the 200 day moving average and 100.76 (04/02/2014 low). A major resistance stands at 110.66 (15/08/2008 high).
USD/CHF has thus far failed to break the strong resistance area between 0.9012 and 0.9037. However, the current mild correction in prices suggests persistent buying interest. An initial support lies at 0.8960. Other supports stand at 0.8908 (05/06/2014 low, see also the 38.2% retracement) and 0.8883. From a longer term perspective, the bullish breakout of the key resistance at 0.8953 suggests the end of the large corrective phase that started in July 2012. The long-term upside potential implied by the double-bottom formation is 0.9207. A key resistance stands at 0.9156 (21/01/2014 high).

