
FLEETCOR Technologies, Inc. (NYSE:FLT) reported strong third-quarter 2019 results wherein both earnings and revenues surpassed the Zacks Consensus Estimate.
Adjusted earnings of $3.10 per share outpaced the consensus estimate by 5 cents and increased 15.7% year over year. Notably, the reported figure came in line with the higher end of the guided range of $3.00-$3.10.
Revenues of $681.05 million beat the consensus mark by $0.9 million and increased 10% year over year on a reported basis and 11% on a pro-forma and macro-adjusted basis.
Organic revenues rose 11% in the reported quarter, driven by solid double-digit growth across the company’s product categories namely fuel, corporate payments, tolls and lodging. Its fuel card business was up 10%, corporate payments increased 24%, toll business grew 17% and lodging business increased 17% organically.
So far this year, shares of FLEETCOR have gained 58.4%, outperforming the 36.4% rise of the industry it belongs to and 21.8% increase in the Zacks S&P 500 composite.

Let's check out the numbers in detail.
Revenues in Detail
Segment-wise, revenues from North America came in at $442.70 million, up 7.2% year over year. Internationally, revenues of $238.34 million increased 15.3% year over year.
Product category-wise, fuel revenues of $295.6 million increased 4% year over year on a reported basis and 10% on a pro-forma and macro-adjusted basis.
Corporate Payments revenues of $138.5 million increased 31% year over year on a reported basis and 24% on a pro-forma and macro-adjusted basis.
Tolls revenues of $88.7 million improved 16% year over year on a reported basis and 17% on a pro-forma and macro-adjusted basis.
Lodging revenues of $56.4 million increased 17% year over year on a reported basis as well as on a pro-forma and macro-adjusted basis.
Gift revenues of $48.5 million decreased 14% year over year on a reported basis and 16% on a pro-forma and macro-adjusted basis.
Other revenues of $53.4 million increased 7% year over year on a reported basis as well as on a pro-forma and macro-adjusted basis.
FleetCor Technologies, Inc. Revenue (TTM)
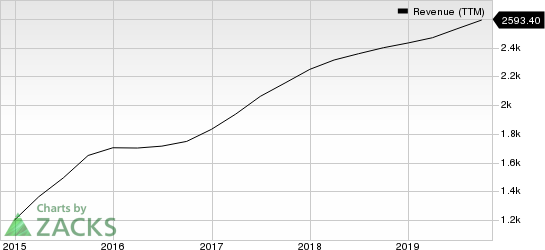
FleetCor Technologies, Inc. revenue-ttm | FleetCor Technologies, Inc. Quote
Operating Results
Operating income increased 17.1% from the prior-year quarter to $329.14 million. Operating income margin rose to 48.3% from 45.4% in the prior-year quarter.
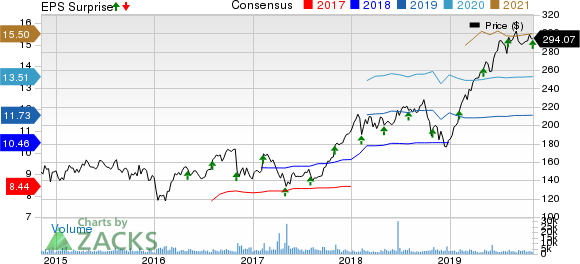
FleetCor Technologies, Inc. Price, Consensus and EPS Surprise
Balance Sheet & Cash Flow
FLEETCOR exited third-quarter 2019 with cash, cash equivalents and restricted cash of approximately $1.47 billion compared with $1.49 billion at the end of the prior quarter.
The company generated $241.11 million of net cash from operating activities. Capital expenditures totaled $16.71 million.
In the reported quarter, FLEETCOR repurchased nearly 184,000 shares for $55 million and has $489 million available under its current authorization. The company’s board of directors authorized an additional $1 billion increase in its previously announced share repurchase program and extended the program by three years. Considering the company’s $1.611 billion of previous repurchases, it can now repurchase up to $1.489 billion by Feb 1, 2023.
2019 Guidance
For 2019, FLEETCOR updated its revenue and adjusted earnings guidance.
Total revenues are now anticipated in the range of $2.64-$2.66 billion compared with the previously guided range of $2.63-$2.68 billion. The current Zacks Consensus Estimate of $2.65 billion lies within the updated guidance.
Adjusted earnings are now expected in the range of $11.68-$11.78 per share compared with the prior guided range of $11.53-$11.83 per share. The current Zacks Consensus Estimate of $11.73 lies within the updated guidance.
Zacks Rank & Other Stocks to Consider
FLEETCOR currently carries a Zacks Rank #2 (Buy). You can see the complete list of today’s Zacks #1 Rank (Strong Buy) stocks here.
A few other top-ranked stocks in the broader Zacks Business Services sector are Global Payments (NYSE:GPN) , Mastercard (NYSE:MA) and Cardtronics (NASDAQ:CATM) . While Global Payments sports a Zacks Rank #1, Mastercard and Cardtronics carry a Zacks Rank #2.
Long-term expected EPS (three to five years) growth rate for Global Payments, Mastercard and Cardtronics is 17%, 15.9% and 4%, respectively.
Wall Street’s Next Amazon (NASDAQ:AMZN)
Zacks EVP Kevin Matras believes this familiar stock has only just begun its climb to become one of the greatest investments of all time. It’s a once-in-a-generation opportunity to invest in pure genius.
Cardtronics PLC (CATM): Free Stock Analysis Report
FleetCor Technologies, Inc. (FLT): Free Stock Analysis Report
Global Payments Inc. (GPN): Free Stock Analysis Report
Mastercard Incorporated (MA): Free Stock Analysis Report
Original post
Zacks Investment Research