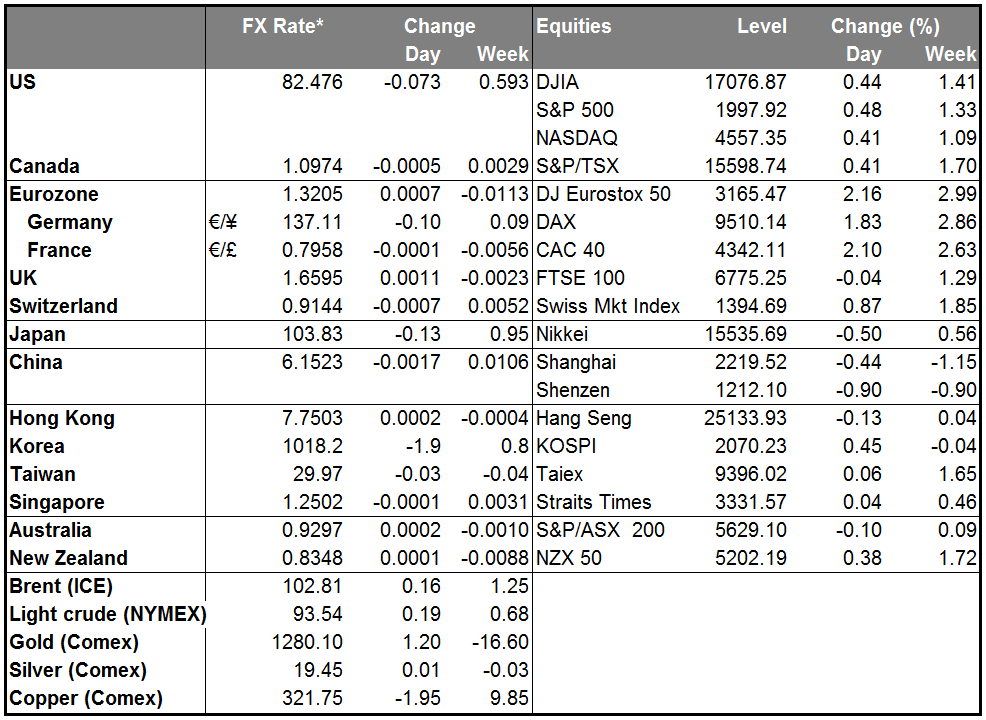
As the ECB gives in on monetary policy and announces more and more easing, the focus of attention is turning to Eurozone fiscal policy. ECB President Draghi Friday entered that debate when he said in his Jackson Hole speech that fiscal policy had an essential role to play in reviving economic activity to bring down unemployment. Then yesterday, French President Hollande dismissed his government after Economic Minister Arnaud Montebourg lashed out at fiscal austerity as the wrong way to go about fostering growth in the economy. If the anti-austerity movement does gain traction, it’s hard to say what the impact on the euro might be. Faster growth and higher yields would probably be euro-positive, but rising debt levels and falling credit ratings would be negative. Certainly the policy mix of looser monetary and fiscal policy has done nothing to help the yen recently. I think a looser fiscal policy is likely to be negative for the euro, at least initially, as investors worry about the loss of discipline, until eventually higher growth might convince them otherwise. In any event, it remains to be seen whether the troubled Eurozone countries can convince Germany that austerity is counter-productive. So far their arguments don’t seem to have convinced the Germans, but the pattern so far in the Eurozone crisis has been for Germany to resist and resist until finally giving in to almost everything.
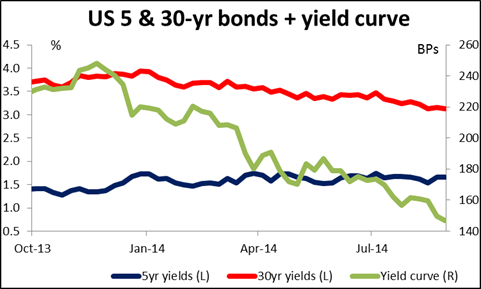
The market continues to adjust up its expectations for US rates. Fed funds futures for two years out and beyond were 2.5 bps higher, while the Treasury yield curve is flattening, with longer-dated yields declining and shorter-dated yields rising – the classic pattern that occurs in anticipation of tighter monetary policy. This is a good sign for the USD. Expectations of Fed tightening are likely to underpin the dollar, which in the past has generally registered strong gains six to nine months before the start of a tightening cycle.
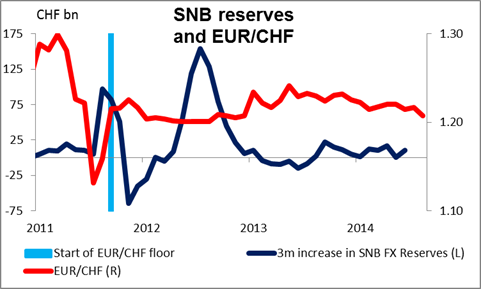
As the euro weakened, the EUR/CHF hit a low of 1.2072 yesterday before bouncing just slightly. This is the lowest level since end-2012. I haven’t heard anything about the Swiss National Bank (SNB) changing its commitment to the 1.20 floor and I don’t expect it to. That means the risk/reward ratio for long the EUR/CHF positions is about as good as it gets right now. The rate can go somewhat lower even within the current framework, and of course the SNB is not required to notify investors before changing its strategy, but past performance – while no guarantee of future performance – does suggest they will keep the rate above 1.20.
Today’s schedule: Russia's President Vladimir Putin meets with Ukraine's President Petro Poroshenko, Customs Union member-states and European Commission officials in Minsk, Belarus. This could be a key event for FX and for gold.
There are no major indicators coming out from Eurozone. Sweden’s PPI is coming out, but no forecast is available. In the UK, the BBA mortgage approvals are expected to have increased in July.
From the US, durable goods orders for July are forecast to rise 8.0% mom, a pickup from +1.7% mom the previous month. On the other hand, durable goods excluding transportation equipment are estimated to have slowed to +0.5% mom from June’s +1.7% mom pace. The Federal Housing Finance Agency (FHFA) home price index is forecast to show that the pace of increase in house prices slightly decelerated in June, while the S P/Case-Shiller house price index for the same month is expected to show no change in prices compared with a small drop in May. Consumer confidence index for August and the Richmond Fed manufacturing index for the same month are expected to decline slightly. Overall these figures are slightly negative, but given the dollar’s tepid response to yesterday’s disappointing new home sales, the dollar may not be that much affected if they come in as anticipated.
We have no speakers scheduled on Tuesday.
The Market
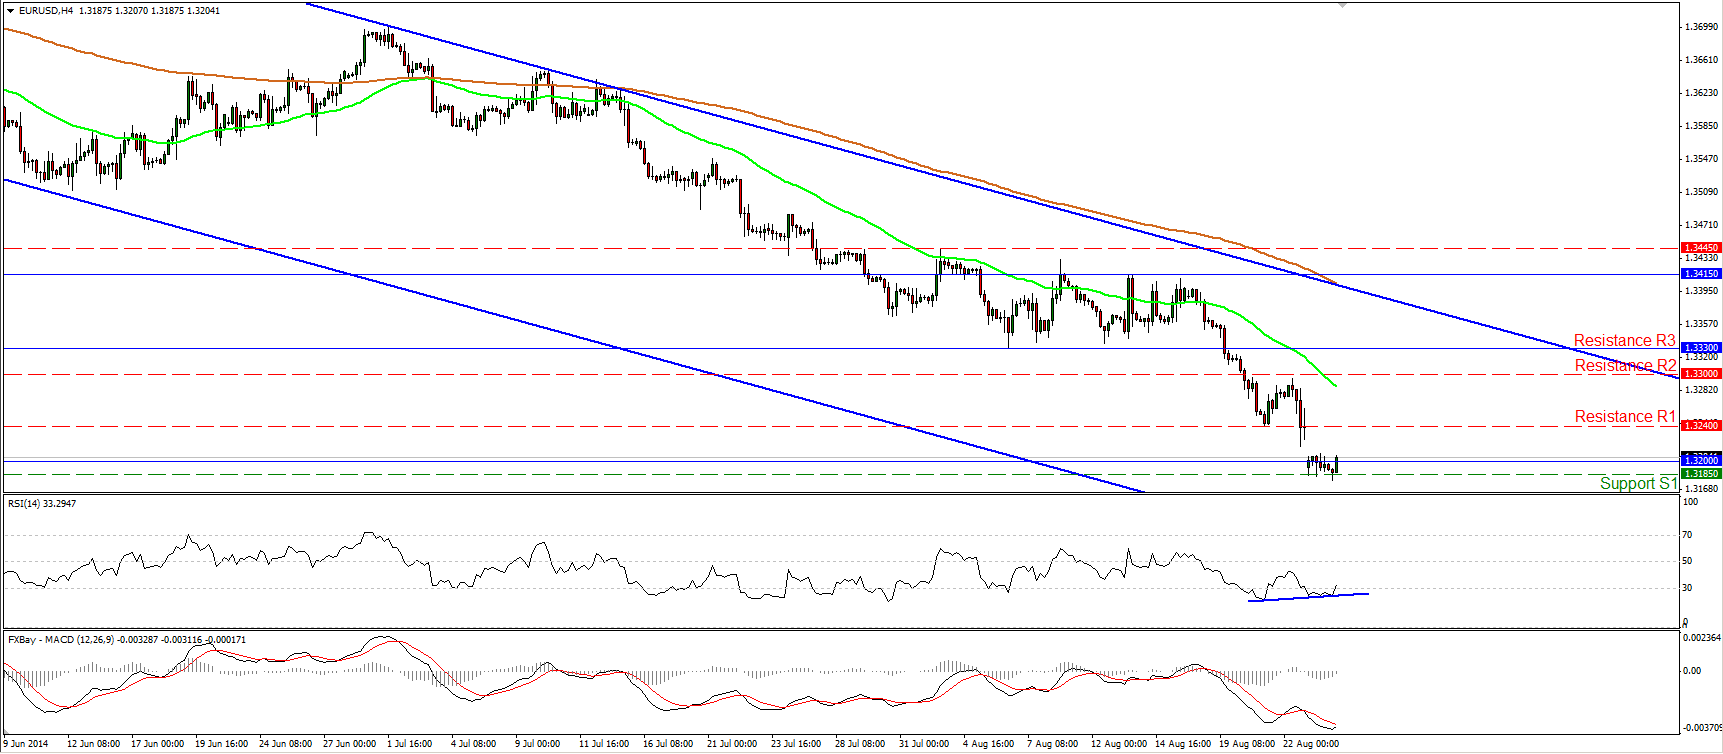
EUR/USD finds strong support at 1.3185
The EUR/USD remained supported by the 1.3185 (S1) line, despite the greater-than-expected decline in all three Ifo indices yesterday. Today, during the early European morning the pair rebounded from that barrier and is back above 1.3200. The RSI exited oversold conditions and is pointing up, while the MACD, although negative, seems ready to move above its trigger line. Having these momentum signs in mind, an upside corrective wave is likely, maybe to challenge the 1.3240 (R1) barrier as a resistance this time. However, I will stick to the view that the overall picture is to the downside. The rate is still trading within the downside channel, connecting the highs and the lows on the daily chart, and a decisive dip below 1.3185 (S1) in the near future could see scope for extensions towards our next support line of 1.3100 (S2).
• Support: 1.3185 (S1), 1.3100 (S2), 1.3000 (S3).
• Resistance: 1.3240 (R1), 1.3300 (R2), 1.3330 (R3).
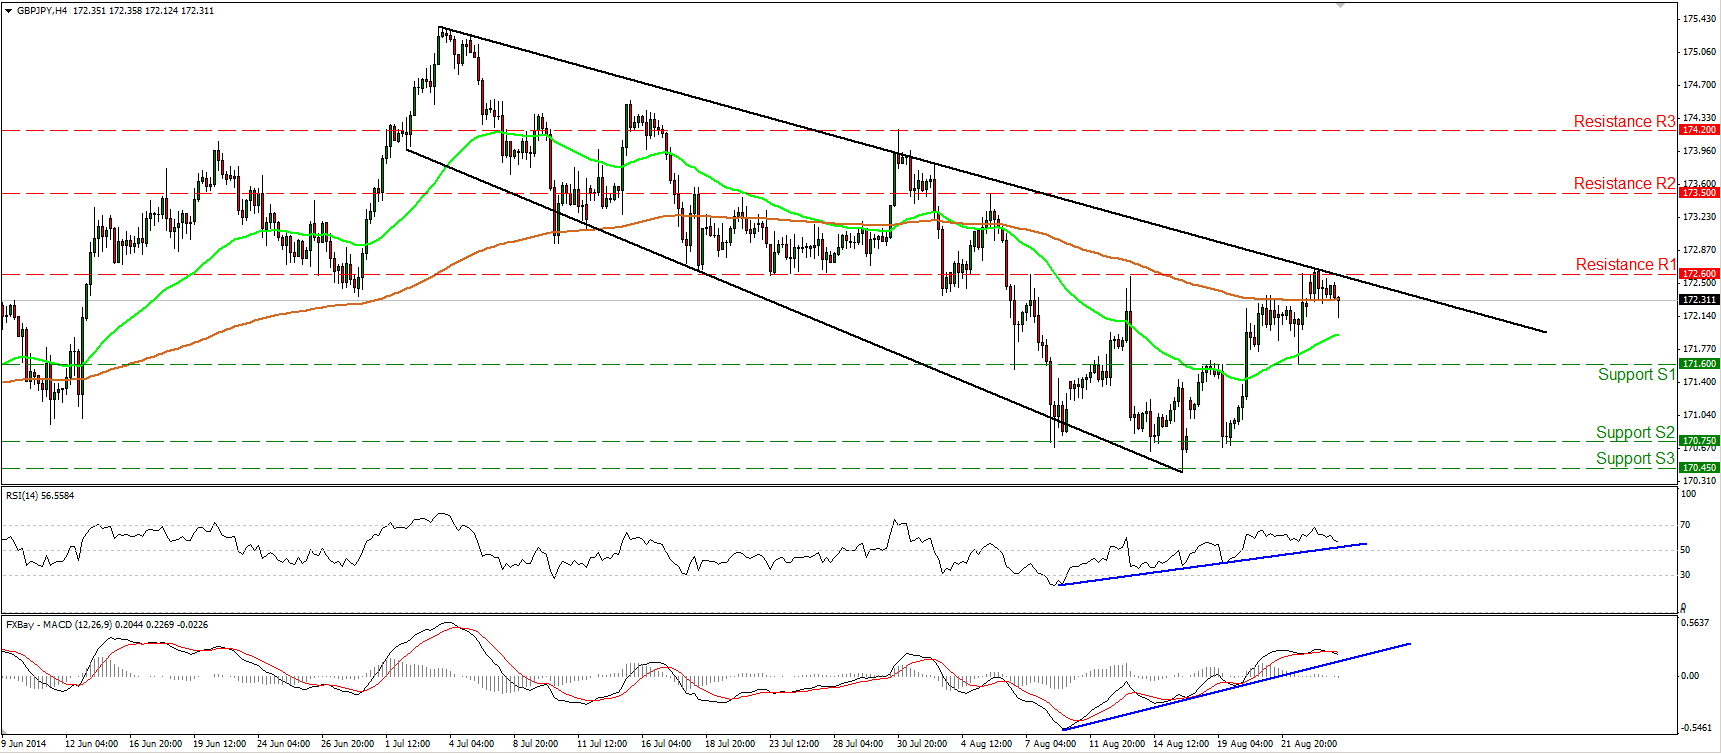
GBP/JPY hits the resistance zone of 172.60
The GBP/JPY moved in a consolidative mode after hitting the resistance line of 172.60 (R1) and the black downside resistance line. Under normal circumstances I would expect the forthcoming wave to be to the downside, but I still see both my momentum indicators within their positive territories and supported by their blue upside support lines. As a result, I would remain neutral here as well until we have clearer directional signals. A clear price dip below 171.60 (S1) alongside a dip by our momentum studies below their support lines is likely to confirm that the downside path is still intact and could target the next support, at 170.75 (S2).
• Support: 171.60 (S1), 170.75 (S2), 170.45 (S3).
• Resistance: 172.60 (R1), 173.50 (R2), 174.20 (R3).
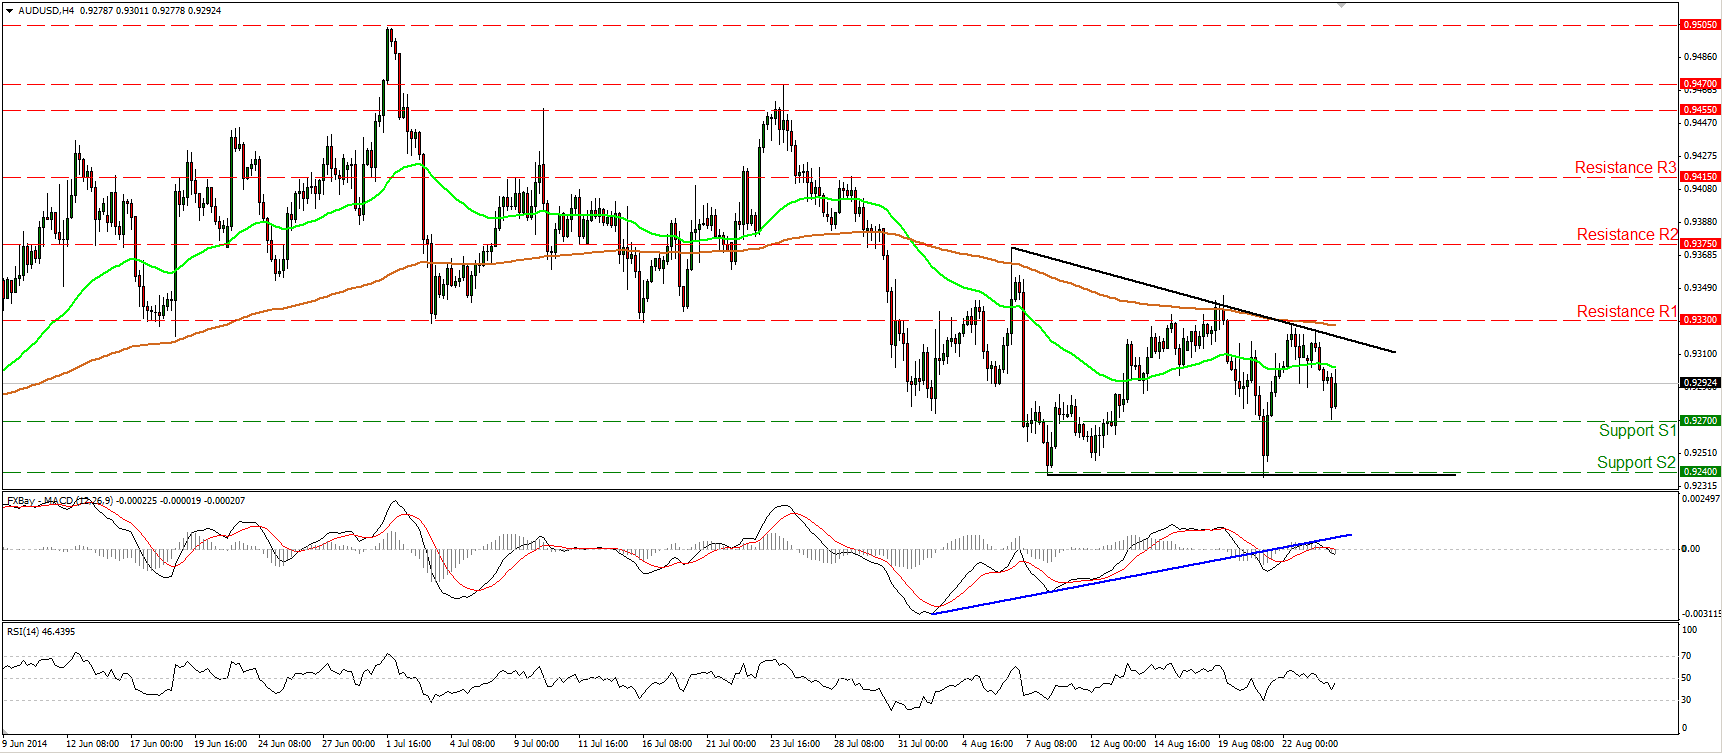
AUD/USD within a possible triangle formation
The AUD/USD moved lower on Monday after finding resistance at the upper boundary of a possible triangle formation, slightly below the 0.9330 obstacle and the 200-period moving average. The MACD found resistance at its prior support line and moved below its signal and zero lines, while the RSI seems ready to re-cross above 50. Considering that the pair is trading within a sideways formation and that we have mixed momentum signals, I would prefer to stay neutral and wait for the rate to break out of the possible triangle. The longer-term picture is cautiously to the downside, since the pair is trading within a downside channel after the completion of a possible complex head and shoulders formation.
• Support: 0.9270 (S1), 0.9240 (S2), 0.9200 (S3).
• Resistance: 0.9330 (R1), 0.9375 (R2), 0.9415 (R3).
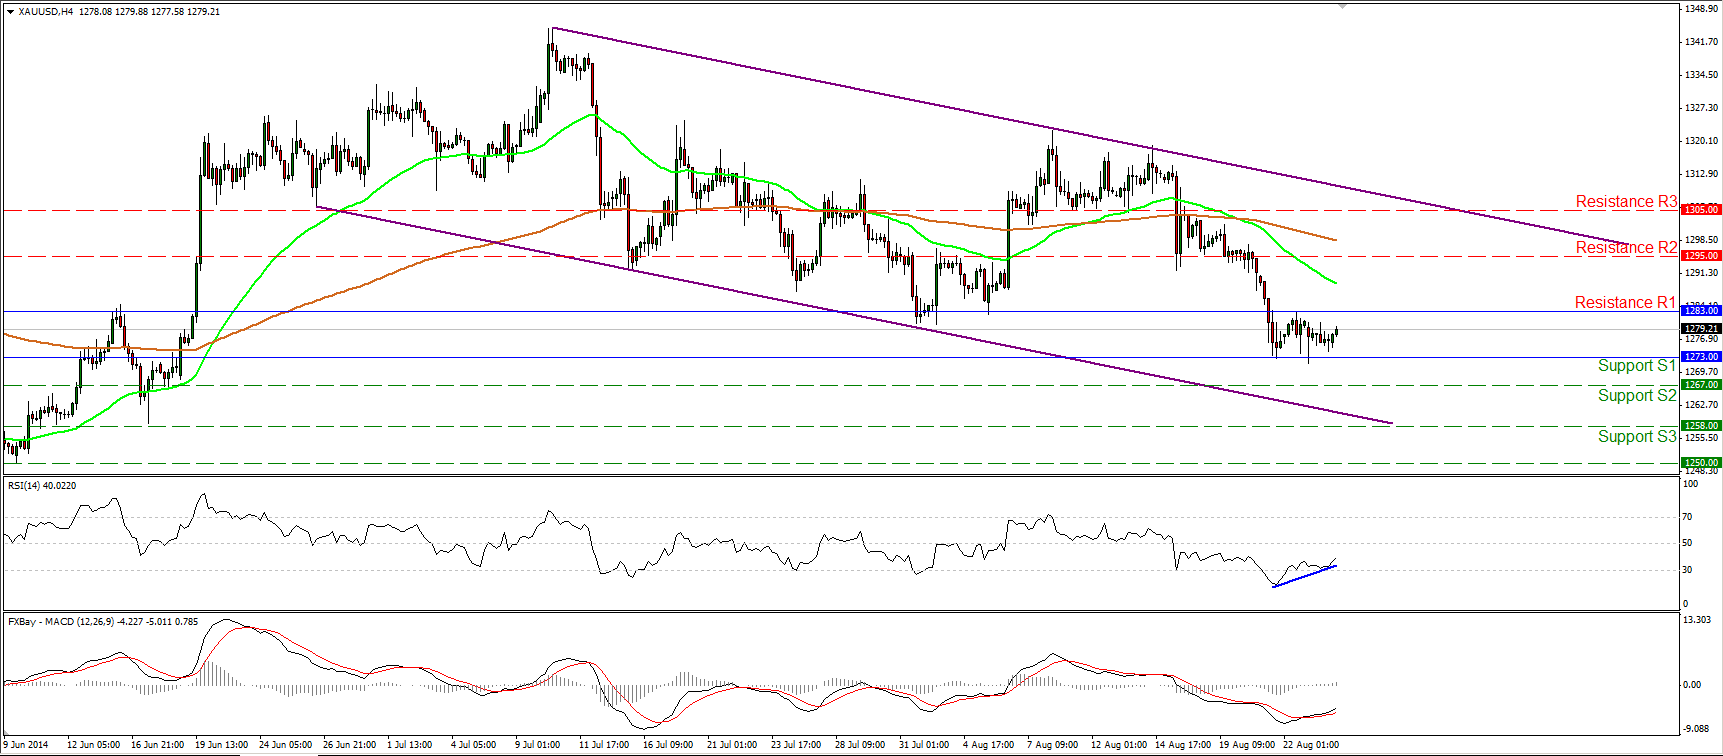
Gold remains within its recent range
Gold moved somewhat higher on Monday, but remained within the range between the support of 1273 (S1) and the resistance of 1283 (R1). The RSI rebounded from its 30 line and is pointing up, while the MACD crossed above its signal line. Bearing these technical signs in mind, I will take to the sidelines for now and will wait for the metal to exit the aforementioned range. A move above 1283 (R1) could confirm our oscillators and could pave the way towards our next resistance at 1295 (R2). On the other hand, a dip below 1273 (S1) is likely to find support at 1267 (S2). In the bigger picture, the yellow metal is trading within a downside channel and this keeps the overall outlook cautiously to the downside.
• Support: 1273 (S1), 1267 (S2), 1258 (S3).
• Resistance: 1283 (R1), 1295 (R2), 1305(R3).
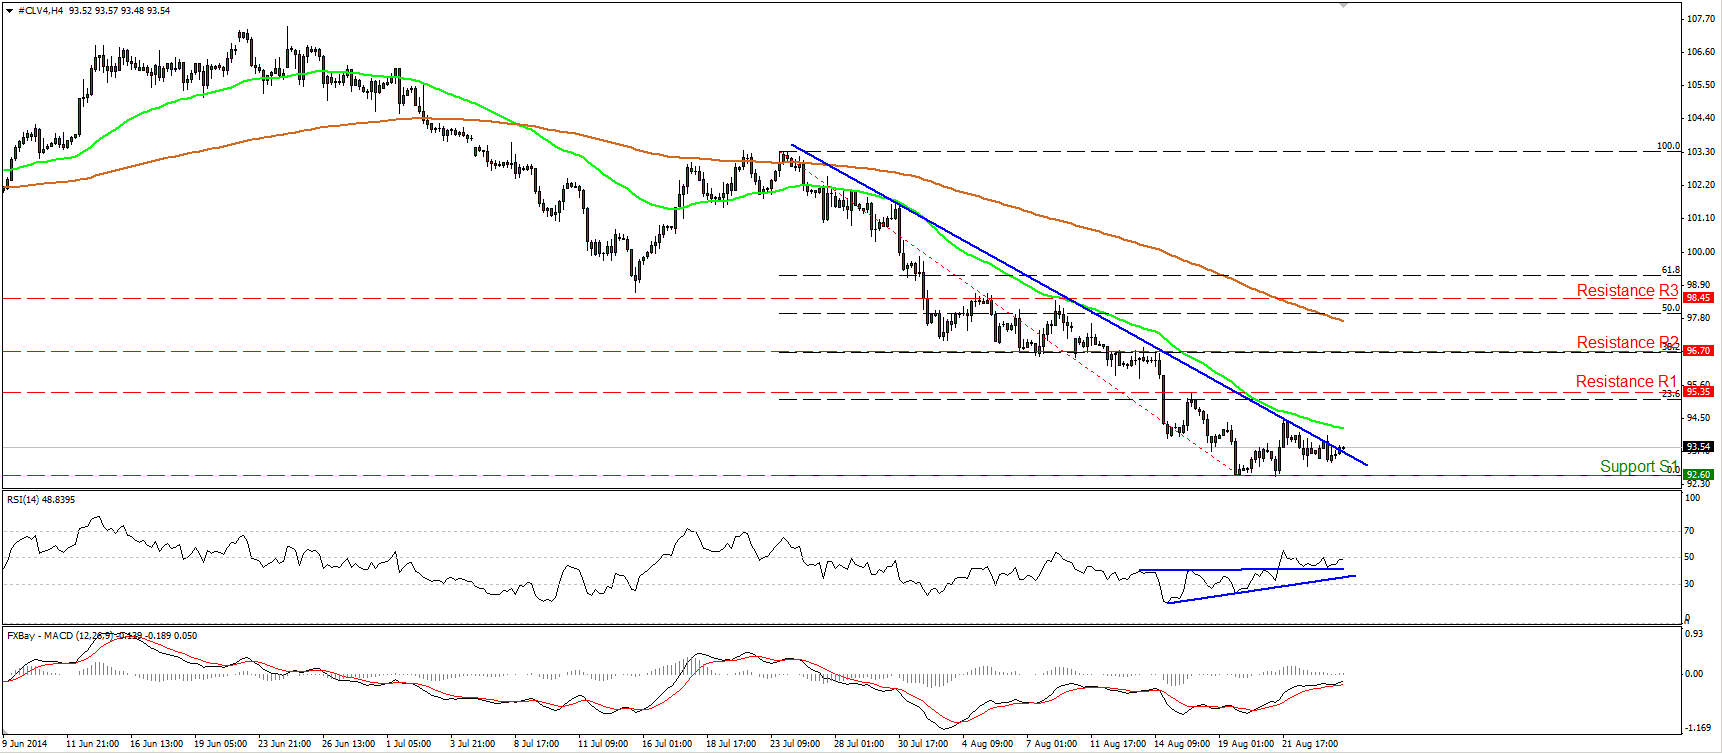
Is WTI ready for a leg higher?
WTI moved in a consolidative mode yesterday, but seems ready to move above the blue short-term downtrend line. The price is at a critical point in my view. Looking at our momentum studies, I would maintain my flat view. The RSI rebounded from a prior resistance line (turned into support), while the MACD, although in its bearish territory, remains above its signal line. Moreover, we have positive divergence between the RSI and the price action. A price move above the trend-line and the resistance of 95.35 (R1) is likely to confirm the divergence and pave the way for the next resistance obstacle at 96.70 (R2), which coincides with the 38.2% retracement level of the 23rd July – 19th August downtrend. On the other hand, we need a dip below 92.60 (S1) to have a forthcoming lower low and the continuation of the downside path. On the daily chart, the 14-day RSI exited its oversold zone, while the daily MACD seems ready to move above its trigger line. This amplifies the case that we may have a decisive move above the trend line in the near future.
• Support: 92.60 (S1), 91.60 (S2), 90.00 (S3).
• Resistance: 95.35 (R1), 96.70 (R2), 98.45 (R3).

