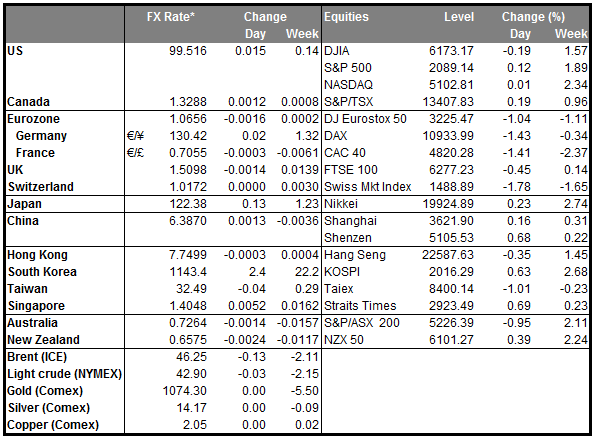
• Fed minutes: FOMC discusses a change in rate path The minutes of the January 26-27 FOMC policy meeting showed that officials were divided on how to interpret the financial market volatility. They expressed concerns that this poses increasing downside risks to the US economy and debated on whether the path for the Fed funds rate should be reconsidered. However, as the impact of the global slowdown on the US economy was still blurry, they agreed that such a move would be premature. They even discussed a hike at that meeting. In our view, this shows that the recent uncertainty caught the committee unprepared, which was reflected in the divided views among its members. Given that the global situation has only worsened since then, we expect the Fed to revise down its median ‘dot plot’ forecasts, at least for 2016, at its March meeting. This would bring the Fed’s projections closer to market expectations, which at the moment, barely point to a single hike this year.
• Iran says thank you but no thanks Iran’s oil minister voiced his support for the plan to freeze oil production at current output, but refrained from committing Tehran to join the agreement. As the Saudi-Russian agreement on Tuesday was conditional upon other major producers freezing output as well, it is unclear whether this deal will be sealed. Oil minister’s diplomatic response left the door open for more talks, but bearing in mind Iran’s eagerness to regain market share, we expect that the nation will not agree to anything unless it is offered some special conditions. WTI rose as Iran did not clearly reject joining in, but we would sound a note of caution on oil’s outlook until the dust settles down.
• Today’s highlights: During the European day, the French CPI is forecast to have accelerated somewhat in January. Sweden’s CPI and CPIF for January are also coming out. Both figures are forecast to have accelerated from the previous month. At its latest meeting, the Riksbank cut interest rates further into negative territory by more than expected in order to safeguard the rise of inflation towards the Bank’s target. However, we believe that accelerating CPI may not reassure the Bank that the upturn in inflation is on a solid footing as this could happen due to energy related base effects arising from the CPI calculation. After all, this is what we saw happening in most of January’s CPI data from other regions. Therefore, we prefer to wait February’s data to come out before assuming that the upturn in inflation is healthy and that the Riksbank could take the sidelines for a while.
• In Eurozone, the ECB releases the minutes of its January policy meeting. At that meeting, the Bank remained on hold but signaled that it will reconsider its policy stance in March as the global market turmoil may have affected Eurozone’s outlook. At his press conference following the meeting, President Draghi said that the Board did not explicitly discuss which tools are more suitable in case of an action. Therefore, we believe that the minutes will provide little new information and may pass unnoticed by the market. Eurozone’s current account balance for December is coming out as well.
• In the US, initial jobless claims for the week ended on the 12th of February are forecast to have risen from the previous week, but the 4-week moving average is expected to have declined. This could confirm that the labor market remains the bright spot in Fed’s chart book. The Philadelphia Fed Business activity index for February is expected to rise a bit, but to remain below the crucial zero mark. Taking into account the disappointment in the Empire State manufacturing index for the same month, another contraction in Philadelphia’s manufacturing activity could increase the likelihood for a print below 50 in the ISM manufacturing PMI due to be released on the 1st of March. This may prove USD-negative, at least at the release.
• We have two speakers scheduled today: San Francisco Fed President John Williams and Norges Bank Governor Oystein Olsen.
The Market
EUR/USD trades in a sideways mode
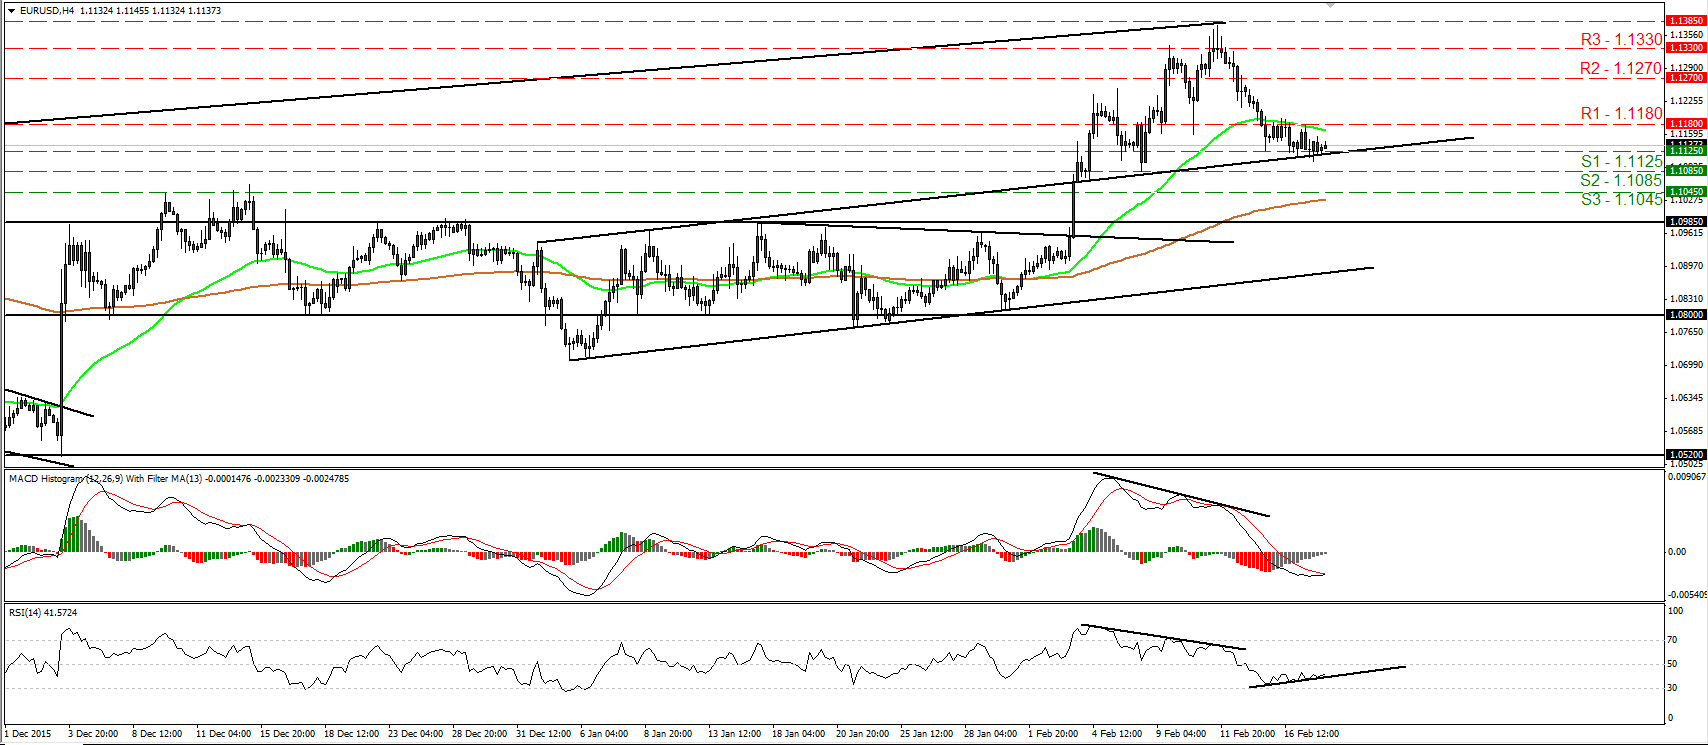
· EUR/USD traded in a consolidative manner yesterday and remained quiet after the Fed minutes showed that officials were divided on how to interpret the financial market volatility. The pair is currently trading near the crossroad between the support of 1.1125 (S1) and the prior upside resistance line taken from the 4th of January. I believe that the retreat started on the 11th of February shows signs of exhaustion and I see the likelihood for the forthcoming wave to be positive. A clear break above 1.1180 (R1) could confirm the case and could set the stage for extensions towards the 1.1270 (R2) area. Our short-term oscillators support the notion as well. The RSI moved slightly higher and could be now headed towards 50, while the MACD, although negative, has bottomed and looks ready to move above its trigger line. As for the broader trend, as long as EUR/USD is trading between the 1.0800 key zone and the psychological area of 1.1500, I would keep the view that the broader trend remains sideways.
· Support: 1.1125 (S1), 1.1085 (S2), 1.1045 (S3)
· Resistance: 1.1180 (R1), 1.1270 (R2), 1.1330 (R3)
AUD/USD slides following weak jobs data from Australia
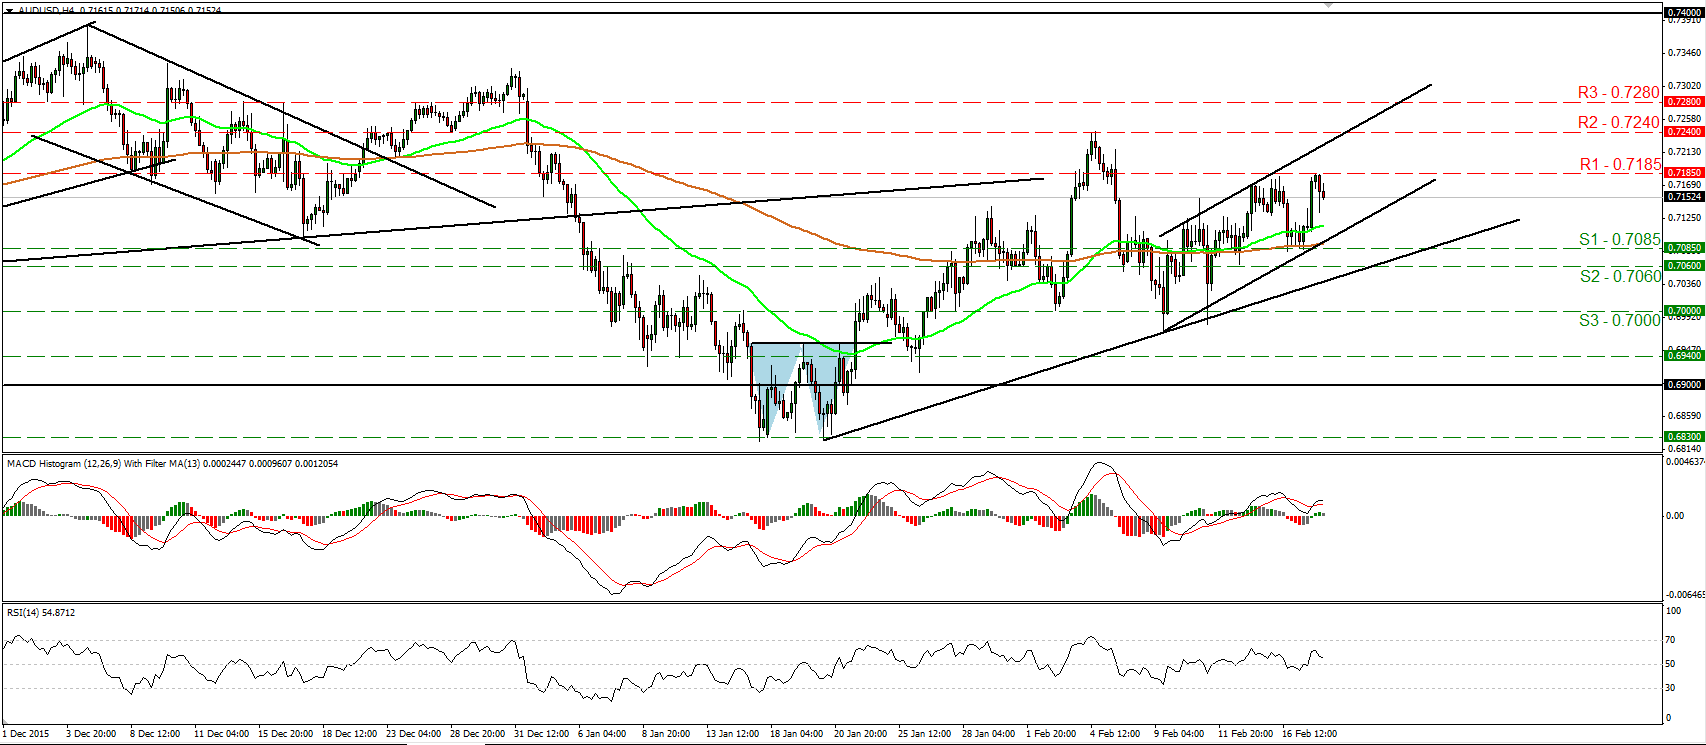
· AUD/USD edged north yesterday, but during the Asian morning Thursday, it hit resistance at 0.7185 (R1) and retreated following the weak Australian employment report. The price structure on the 4-hour chart suggests a short-term uptrend and therefore, a clear break above 0.7185 (R1) is possible to open the way for the next resistance at 0.7240 (R2). However, for now I see the possibility for the current setback to continue for a while, perhaps to challenge the upside support line taken from the low of the 9th of February, or the 0.7085 (S1) support barrier. The likelihood for further retreat is visible on our short-term momentum studies as well. The RSI has turned down and could fall back below 50 soon, while the MACD, although positive, shows signs of topping and could fall below its trigger line. As for the bigger picture, given that the rate is trading within the sideways range between 0.6900 and 0.7400, I would hold a “wait and see” stance as far as the medium-term bias is concerned.
· · Support: 0.7085 (S1), 0.7060 (S2), 0.7000 (S3)
· Resistance: 0.7185 (R1), 0.7240 (R2), 0.7280 (R3)
EUR/GBP could be headed towards 0.7870
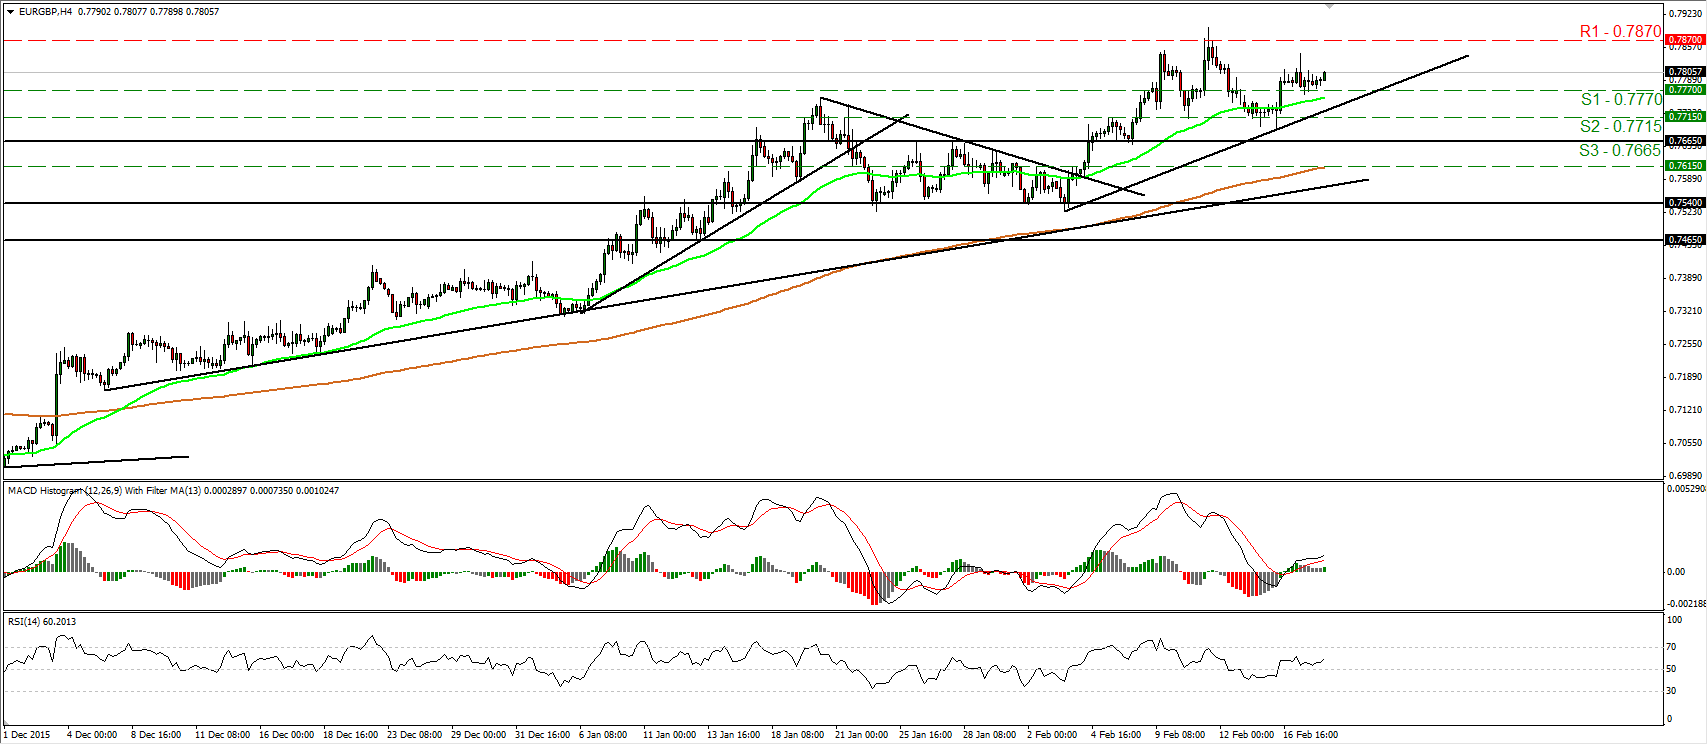
· EUR/GBP traded in a consolidative manner on Wednesday, staying slightly above the support barrier of 0.7770 (S1). Given that the rate traded higher on Tuesday after it found support slightly above the upper bound of the 21st of January – 4th of February sideways range, I would consider the short-term outlook to stay positive. I would expect the bulls to regain momentum at some point and drive the rate higher for a test near the 0.7870 (R1) zone. However, a break above that zone is needed to confirm a forthcoming higher high, something that could open the way for the psychological zone of 0.8000 (R2). Our short-term oscillators detect upside speed and corroborate my view for another leg higher. The RSI rebounded from near its 50 line and could be now headed towards 70, while the MACD stands above both its zero and trigger lines, and points somewhat up. Switching to the daily chart, I see that on the 8th of January, the rate managed to emerge above the upper bound of the sideways range the pair had been trading since the beginning of February 2015. Therefore, I would consider the medium-term outlook to stay positive as well.
· · Support: 0.7770 (S1), 0.7715 (S2), 0.7665 (S3)
· Resistance: 0.7870 (R1), 0.8000 (R2), 0.8060 (R3)
Gold trades quietly, slightly below 1215
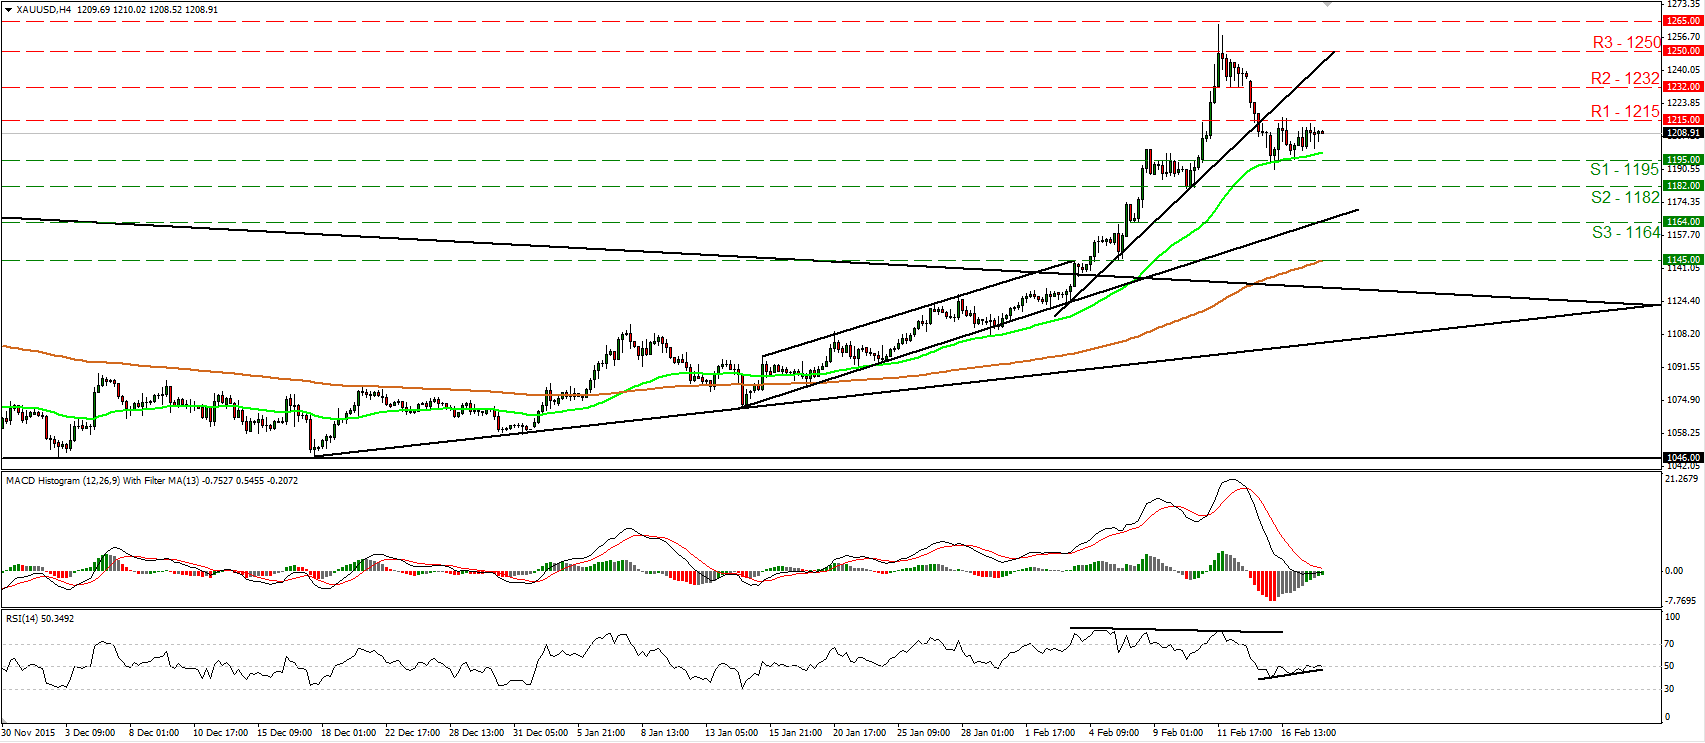
· Gold traded in a quiet mode on Wednesday, staying between the support of 1195 (S1) and the resistance of 1215 (R1). Currently the metal is trading slightly below the 1215 (R1) resistance line, where a clear break could open the way for the next hurdle zone of 1232 (R2). Although the yellow metal is trading below the short-term uptrend line taken from the low of the 3rd of February, I see the possibility for a bounce higher. This is also visible on our short-term oscillators. The RSI edged up and just crossed above its 50 line, while the MACD shows signs of bottoming fractionally below zero. Switching to the daily chart, I see that on the 4th of February, the price broke above the long-term downside resistance line taken from the peak of the 22nd of January 2015. As a result, I would consider the medium-term outlook to be cautiously positive and I would treat the setback from 1265 as a corrective phase for now.
· · Support: 1195 (S1), 1182 (S2), 1164 (S3)
· Resistance: 1215 (R1), 1232 (R2), 1250 (R3)
WTI rallies as Iran supports output freeze
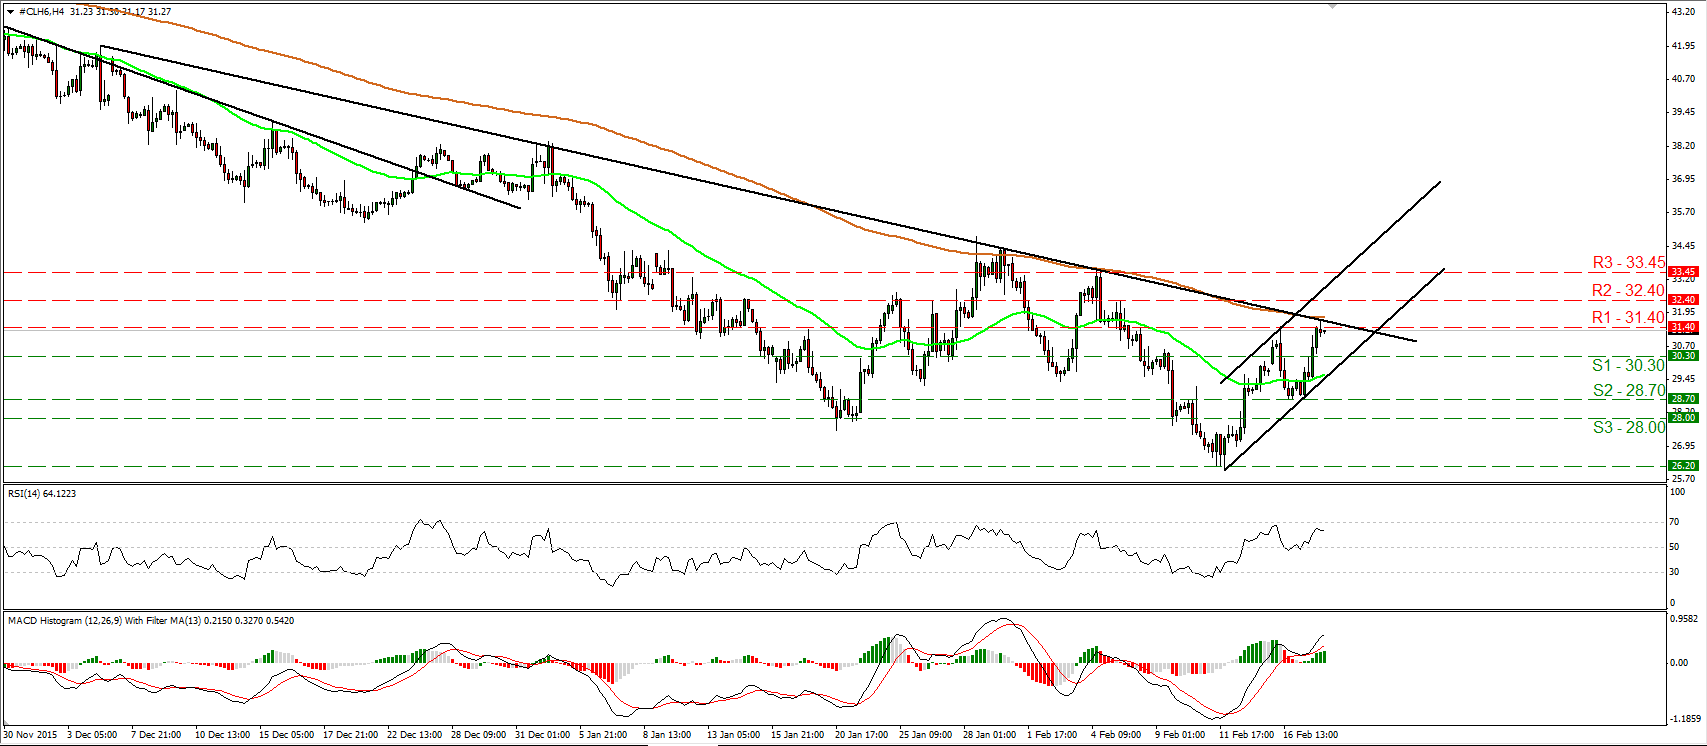
· WTI rallied yesterday, after Iran’s oil minister voiced support for a plan to freeze output at current levels. However, he refrained from committing Tehran to follow suit. The price surged following the news and hit resistance at the downtrend line taken from the peak of the 4th of December, marginally above the 31.40 (R1) line. As long as WTI is trading below that trend line, the outlook remains negative. However, a break higher could change the picture and could set the stage for larger bullish extensions. Looking at our short-term oscillators, I see that the RSI moved higher, but stopped slightly below 70 and turned down. The MACD stands above both its zero and trigger lines. These indicators support the recent positive sentiment and leave the door open for a move above the aforementioned trend line. On the daily chart, I see that WTI has been printing lower peaks and lower troughs since the 9th of October, which keeps the longer-term picture negative. However, I see positive divergence between both our daily oscillators and the price action, something that increases the possibilities for WTI to continue correcting higher.
· Support: 30.30 (S1), 28.70 (S2), 28.00 (S3)
· Resistance: 31.40 (R1), 32.40 (R2), 33.45 (R3)


