
The US dollar and Wall Street gained yesterday, after the minutes of the latest FOMC decision revealed that policymakers remained optimistic with regards to the performance of the US economy. However, Asian markets pulled back today, perhaps as investors translated this as leaving the door open for double hikes in June and July, and maybe more aggressive tightening thereafter if inflation does not slow.
Dollar Gains After the Minutes Reveal Officials Were Confident On The Economy
The US dollar traded higher against all but two of the other major currencies on Wednesday and during the Asian session Thursday. It underperformed only against GBP, while it was found virtually unchanged against NZD and AUD.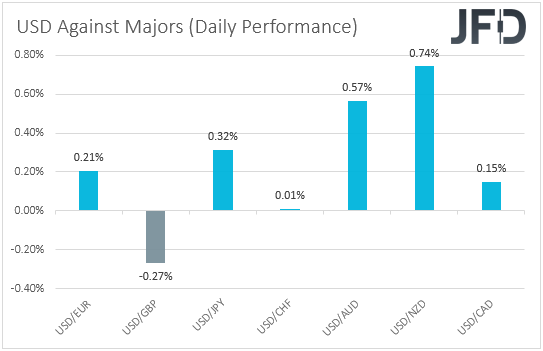
The strengthening of the US dollar and the Swiss franc, combined with the weakening of the risk-linked Aussie and Kiwi suggests that market sentiment deteriorated at some point yesterday or today in Asia. However, turning our gaze to the equity world, we see that major EU and US indices traded in the green. Only today in Asia appetite softened.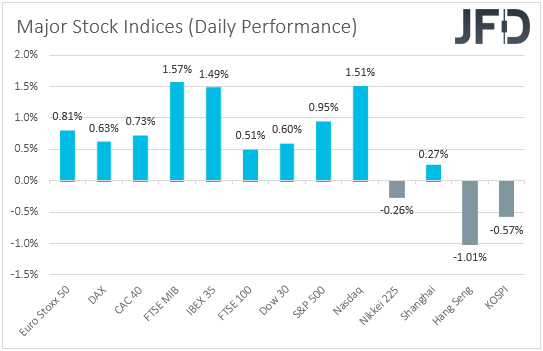
Yesterday, the main event on the economic agenda was the minutes from the latest FOMC gathering, where officials decided to hike by 50bps for the first time after 22 years but dismissed chances over a 75bps liftoff at one of the upcoming gatherings, noting that they will likely proceed with double hikes in the next couple of meetings as well. Back then, the US dollar weakened, but as soon as investors digested the idea that even with double hikes, the Fed remains among the most hawkish major central banks, they bought back some dollars.
In any case, lately, the greenback came back under selling interest due to concerns with regards to the performance of the US economy, but yesterday, the minutes revealed that Fed officials remained confident on that front, and that’s why we saw the US dollar and US equities being bought. However, confidence in the economy means that they are willing to proceed with the planned hikes, and with Powell saying recently that they are willing to do more, if necessary, the chances for bigger hikes after summer, if inflation does not slow, are not zero. That’s maybe why Asian stocks slid today.
In any case, although we see chances for some indices to continue trading south, we are reluctant to assume that the US dollar has ended its latest correction and its ready to enter bullish mode again. The reason is because concerns over the US economy emerged after the FOMC gathering, so the opinion of policymakers expressed in the minutes may be a little bit outdated. Therefore, we see the case for the US dollar to continue weakening for a while more, at least until we get clearer signals that indeed officials remain optimistic now as well.
NASDAQ 100 – Technical Outlook
The NASDAQ 100 traded slightly higher yesterday but stayed below the downside resistance line drawn from the high of April 5. Overall, the index has been oscillating below that line and above 11505 since Friday, suggesting indecision for now. However, from a technical standpoint, as long as the price remains below the downside resistance line, the bears could take charge again.
Yesterday’s recovery may continue for a while more, but the bears may jump back into the action from near the 12175 zone, marked by the inside swing low of May 16. This could result in a slide and another test near the 11505 zone, marked by the low of May 20, the break of which would confirm a forthcoming lower low and perhaps see scope for declines towards the 10940 territory, marked by the low of Nov. 2, 2020.
On the upside, we would like to see a clear break above 12550, which provided strong resistance between May 10 and 18, before we start examining a bullish reversal. This will confirm the break above the aforementioned downside resistance line and could initially target the high of May 6, at around 12935, the break of which could carry larger advances, perhaps towards the 13545 zone, which provided strong resistance between Apr. 26 and May 5, or towards the 13745 territory, marked by the low of Apr. 18.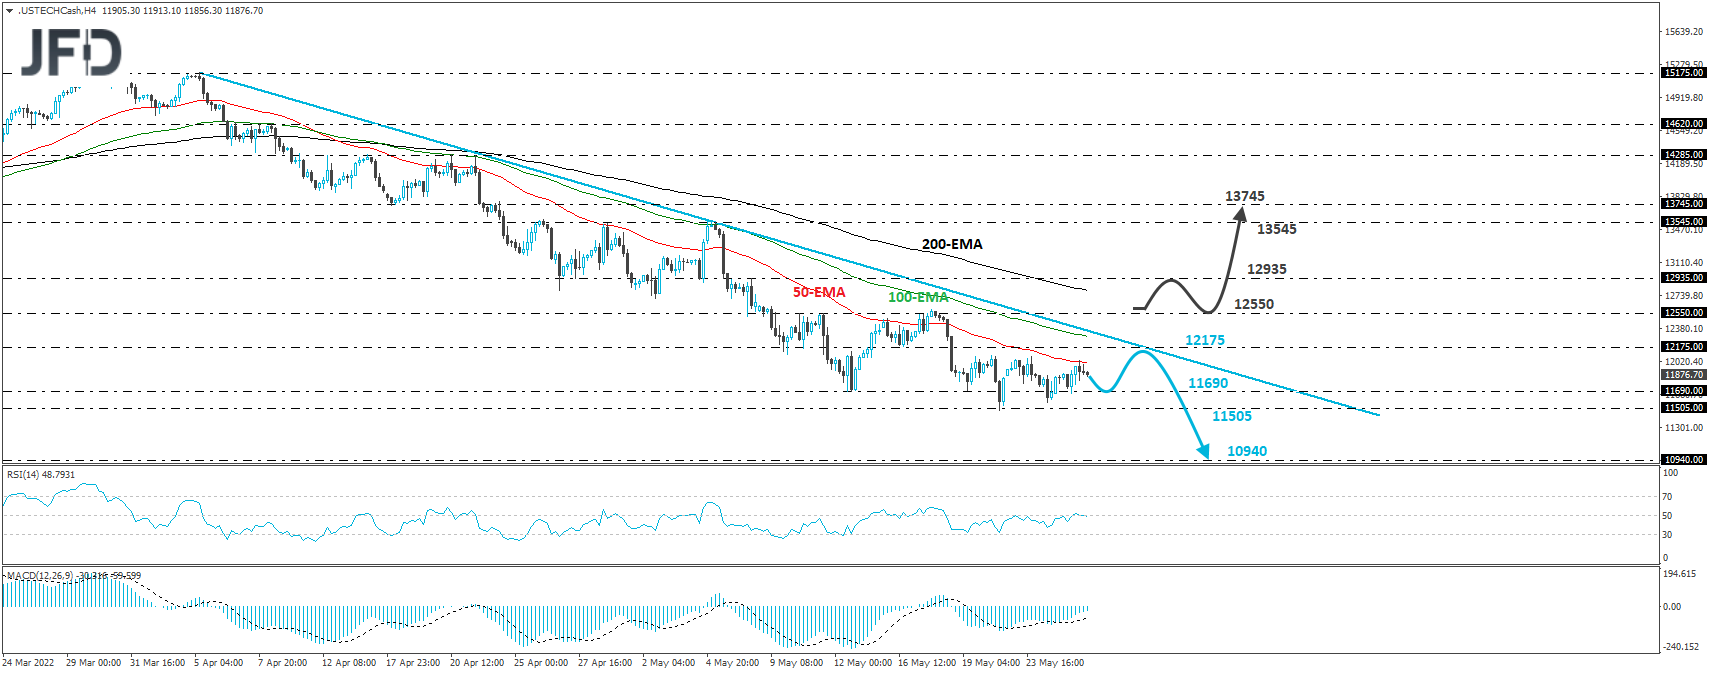
EUR/USD – Technical Outlook
EUR/USD traded lower yesterday, but hit support near the 1.0640 zone, staying above the upside line drawn from the low of May 13, and then, it rebounded somewhat. Overall, the pair continues to print higher highs and higher lows above that line, and also trades above the prior downside resistance line taken from the high of Mar. 31. Thus, we will consider the short-term picture to still be somewhat positive.
The bulls could take charge again soon and perhaps aim for the 1.0760 territory, marked by the by the inside swing lows of Apr. 14 and 19. If they are not willing to stop there, we may see them aiming for the 1.0845 zone, where another break could target the key obstacle of 1.0935, which acted as a temporary ceiling between Apr. 6 and 21. Another break, above 1.0935, could see scope for more advances, perhaps towards the 1.1025 area, marked by the inside swing low of Apr. 1.
On the downside, we would like to see a clear dip below 1.0470 before we reconsider the bearish case. Such a move would confirm the rate’s return back below both the aforementioned diagonal lines, and may initially target the 1.0350 zone, marked by the lows of May 12 and 15, the break of which could carry larger bearish implications, perhaps setting the stage for a teste near the 1.0235 territory, marked by the inside swing high of July 2002.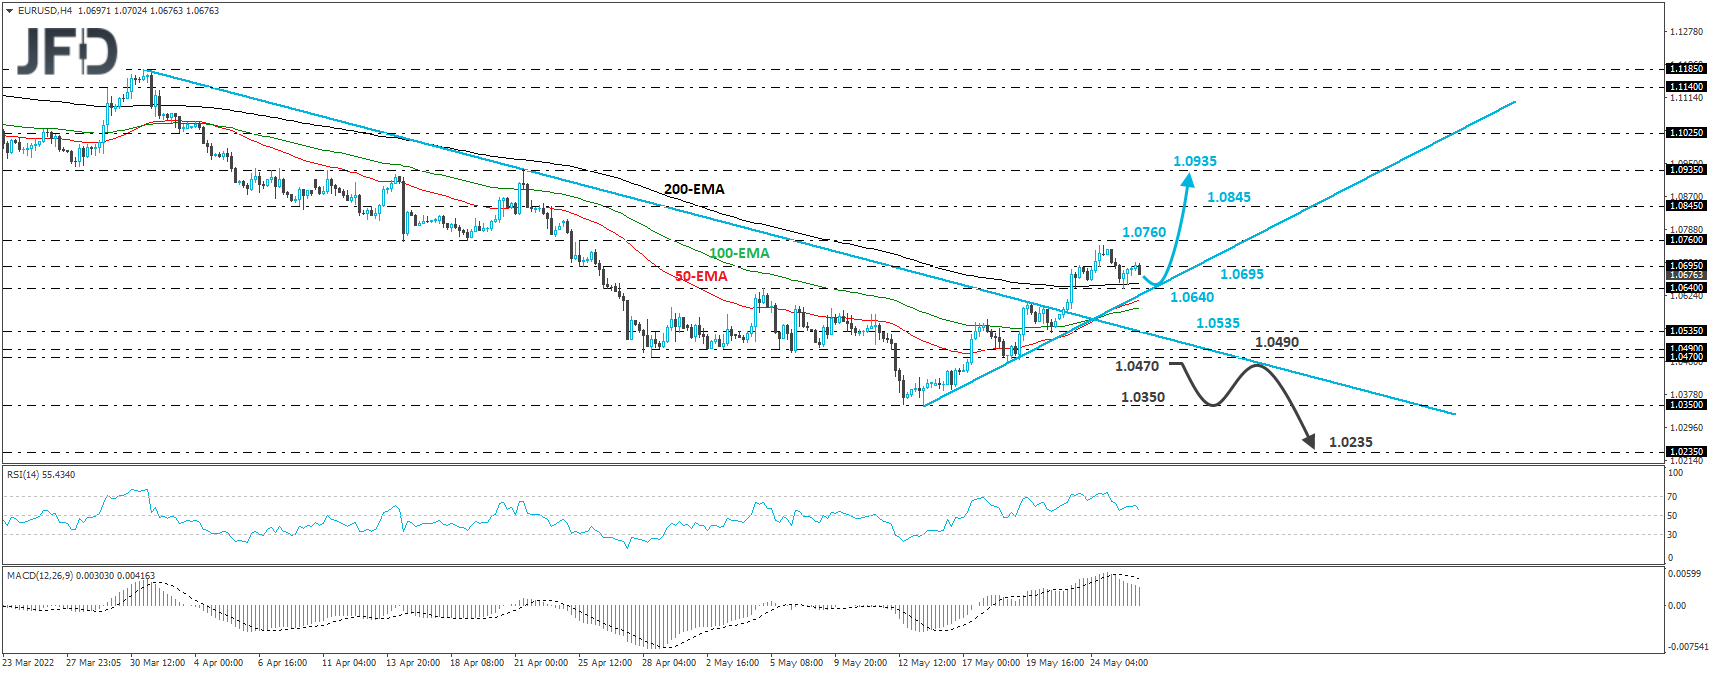
As for Today’s Events
Markets in Switzerland will stay closed due to the Ascension Day, while later in the day, we have the second estimate of the US GDP for Q1, with the forecasts suggesting a confirmation of the preliminary numbers. Canada’s retail sales for March are also due to be released. Headline sales are expected to have accelerated to +1.4% mom from +0.1%, while the core rate is forecast to have ticked down to +2.0% mom from +2.1%. With Canada’s CPIs coming in above estimates last week, decent retail sales may allow market participants to keep the BoC into the group of the major central banks expected to continue raising interest rates at a fast pace.
During the Asian session Friday, we have Japan’s Tokyo CPIs for May and Australia’s retail sales for April. No forecast is available for the headline Tokyo rate, but the core one is anticipated to have ticked up to +2.0% yoy from +1.9%. As for Australia’s retail sales, they are expected to slow to +1.0% mom from +1.6%.