On Tuesday morning, Wal-Mart Stores Inc (NYSE:WMT) reported a 15% drop in profits year-over-year and warned they would be dropping estimates for forthcoming periods. I’ve placed countless thousands of trades in my life, but I don’t think I’ve ever traded a single share of Wal-Mart. In spite of this, I decided to dust off the WMT chart and take a look at what was going on.
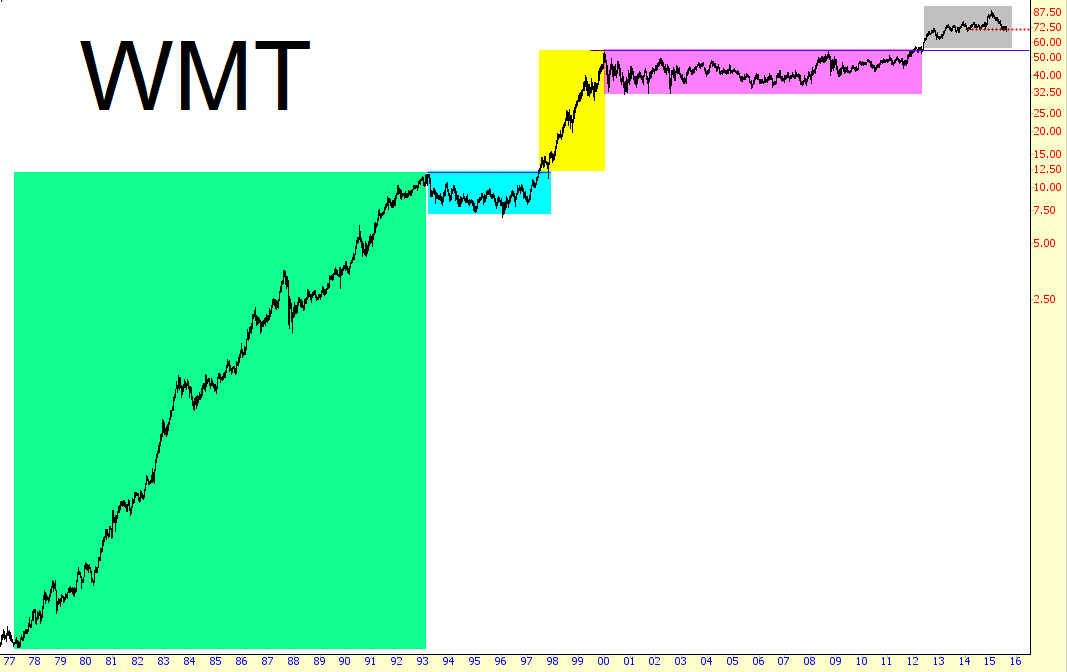
Take a look at this long-term chart of the company below (click for a larger image):

I’ve tinted the chart various colors to indicate these broad periods:
- Green – the Growth Years (1977-1993): this was the period where long-term holders were awarded with life-changing gains. The stocked moved up 33,000%. A few thousand bucks bought while Jimmy Carter was President was worth a million bucks around the time Bill Clinton was inaugurated. The ascent in the stock was virtually uninterrupted. This is a textbook example of a long-term growth stock.
- Cyan – Short Stagnation (1993-1997): The stock spent about half a decade digesting its gains and going nowhere. Latecomers, envious of the eye-popping returns from the “green” period, jumped on board, but they were evenly matched by those taking profits. After five years, a newcomer to the stock would have nothing to show for it.
- Yellow – Internet Wannabe (1997-2000): Here the stock enjoyed the zany market of the late 1990s and also rode along Amazon’s coattails. The gain of 260% which was nothing to sneeze at, but 260% isn’t 33,000%. The big money had been made already.
- Magenta – Long Stagnation (2000-2012): Here was a dozen year period in which WMT lost about a third of its value and gained it back again a number of times. There was plenty of money to be made by swing traders, but long-term holders, after a full dozen years, had absolutely nothing to show for their patience.
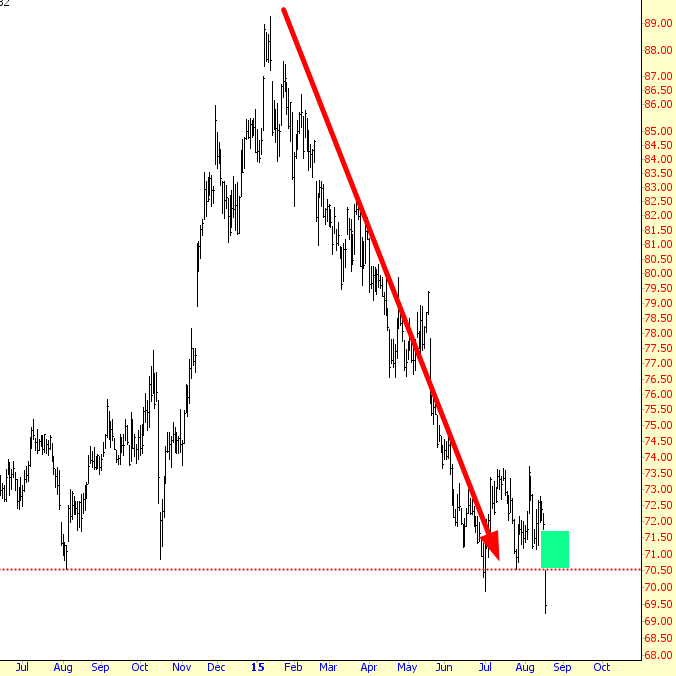
- Gray – Sputter (2012-Present): Wal-Mart starting regaining some of its past glory during the start of this period, and by January of this year, it reached the highest price in its entire multi-decade history as a public entity. It was up about 65% at that time from the start of the “gray” period, but then it started to slip. As you can see by the more detailed chart below, the stock eroded its gains away, and at present, less than half of the “gray” profits still exist. I’ve put a green tint to show the gap-down in price today.

Thus, over the past half-year, sixty billion dollars in shareholder wealth have vanished, and it seems altogether likely that Wal-Mart has seen its peak stock price for a long, long time.
What’s striking to me about the recent activity is that this a singularly ugly period of WMT stock behavior. Over the years, there has been a lot of “backing and filling”, but what’s happened over the past six months is a different beast altogether: lots of “backing” and hardly any “filling”.
I think we’re witnessing a sea change in the behavior of Wal-Mart, and this is probably a helpful harbinger of the American economy as a whole.
